| Red | Green | Blue | |
| z | 17.64 | ||
| znorm | Inf | ||
| sky | -Inf | -Inf | -Inf |
| S/N | 16.8 | 31.2 | 33.6 |
| S/N(c) | 0.0 | 0.0 | 0.0 |
| SN(E/C) |
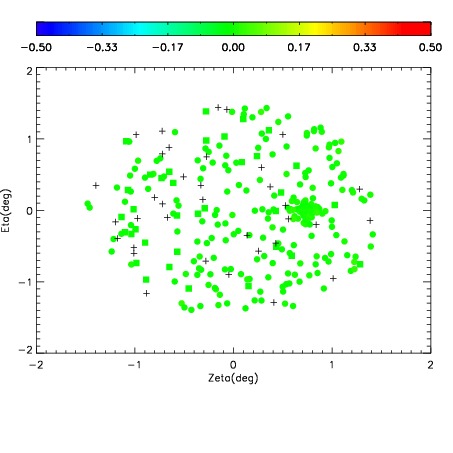
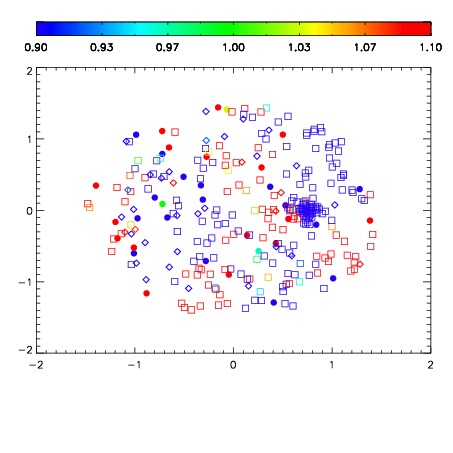


| Frame | Nreads | Zeropoints | Mag plots | Spatial mag deviation | Spatial sky 16325A emission deviations (filled: sky, open: star) | Spatial sky continuum emission | Spatial sky telluric CO2 absorption deviations (filled: H < 10) | |||||||||||||||||||||||
| 0 | 0 |
|
|
|
|
|
|
| IPAIR | NAME | SHIFT | NEWSHIFT | S/N | NAME | SHIFT | NEWSHIFT | S/N |
| 0 | 07900072 | 0.471404 | 0.00000 | 18.3927 | 07900077 | -0.000597882 | 0.472002 | 18.3723 |
| 1 | 07900075 | 0.470005 | 0.00139898 | 18.5488 | 07900070 | 0.00000 | 0.471404 | 18.4859 |
| 2 | 07900076 | 0.469440 | 0.00196397 | 18.4339 | 07900074 | -0.000644045 | 0.472048 | 18.4217 |
| 3 | 07900071 | 0.470378 | 0.00102597 | 18.4288 | 07900073 | -0.000271671 | 0.471676 | 18.3814 |