| Red | Green | Blue | |
| z | 17.64 | ||
| znorm | Inf | ||
| sky | -Inf | -Inf | -Inf |
| S/N | 11.7 | 20.6 | 22.9 |
| S/N(c) | 0.0 | 0.0 | 0.0 |
| SN(E/C) |
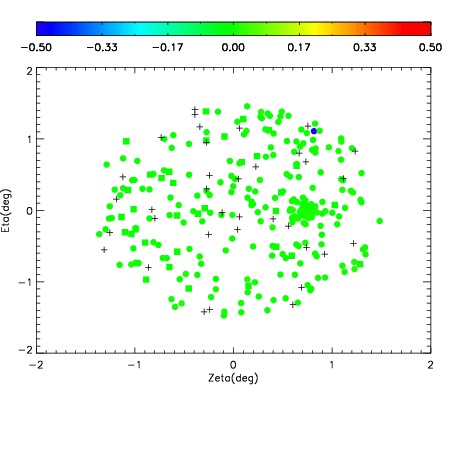
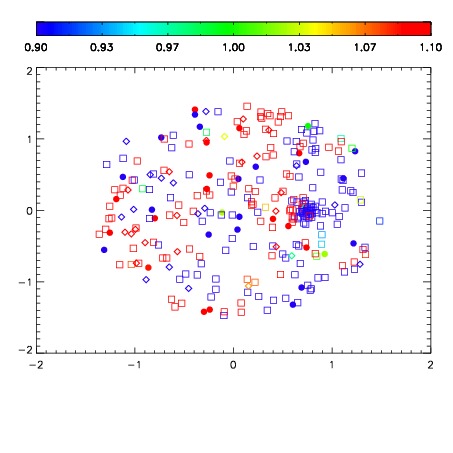
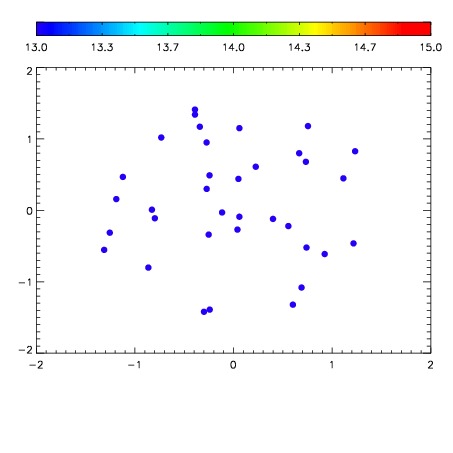

| Frame | Nreads | Zeropoints | Mag plots | Spatial mag deviation | Spatial sky 16325A emission deviations (filled: sky, open: star) | Spatial sky continuum emission | Spatial sky telluric CO2 absorption deviations (filled: H < 10) | |||||||||||||||||||||||
| 0 | 0 |
|
|
|
|
|
|
| IPAIR | NAME | SHIFT | NEWSHIFT | S/N | NAME | SHIFT | NEWSHIFT | S/N |
| 0 | 05210039 | 0.502558 | 0.00000 | 17.9115 | 05210044 | 0.00189060 | 0.500667 | 17.7476 |
| 1 | 05210038 | 0.502468 | 9.00030e-05 | 18.1464 | 05210037 | 0.00000 | 0.502558 | 18.0397 |
| 2 | 05210043 | 0.497416 | 0.00514200 | 17.9356 | 05210040 | 0.000127033 | 0.502431 | 17.8991 |
| 3 | 05210042 | 0.496469 | 0.00608900 | 17.6728 | 05210041 | -0.00121432 | 0.503772 | 17.6673 |