| Red | Green | Blue | |
| z | 17.64 | ||
| znorm | Inf | ||
| sky | -NaN | -NaN | -Inf |
| S/N | 26.5 | 45.7 | 48.5 |
| S/N(c) | 0.0 | 0.0 | 0.0 |
| SN(E/C) |
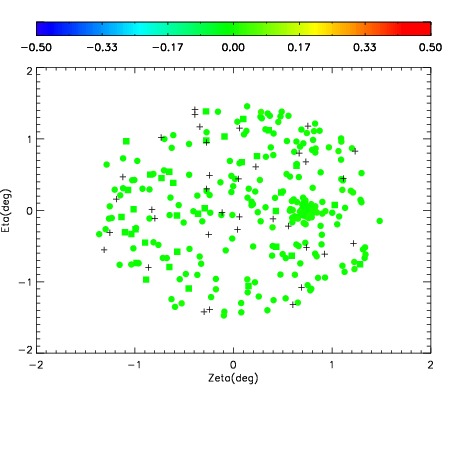


| Frame | Nreads | Zeropoints | Mag plots | Spatial mag deviation | Spatial sky 16325A emission deviations (filled: sky, open: star) | Spatial sky continuum emission | Spatial sky telluric CO2 absorption deviations (filled: H < 10) | |||||||||||||||||||||||
| 0 | 0 |
|
|
|
|
|
|
| IPAIR | NAME | SHIFT | NEWSHIFT | S/N | NAME | SHIFT | NEWSHIFT | S/N |
| 0 | 08770038 | 0.480736 | 0.00000 | 18.9650 | 08770036 | 0.00157994 | 0.479156 | 18.9508 |
| 1 | 08770037 | 0.479677 | 0.00105900 | 19.0033 | 08770039 | 0.00411175 | 0.476624 | 19.0303 |
| 2 | 08770034 | 0.478176 | 0.00255999 | 18.9372 | 08770035 | 0.00195272 | 0.478783 | 18.9365 |
| 3 | 08770033 | 0.477234 | 0.00350198 | 18.9259 | 08770032 | 0.00000 | 0.480736 | 18.8202 |