| Red | Green | Blue | |
| z | 17.64 | ||
| znorm | Inf | ||
| sky | -NaN | -Inf | -Inf |
| S/N | 29.6 | 45.4 | 52.8 |
| S/N(c) | 0.0 | 0.0 | 0.0 |
| SN(E/C) |


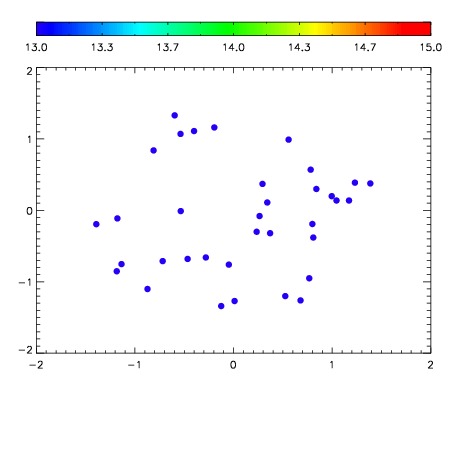

| Frame | Nreads | Zeropoints | Mag plots | Spatial mag deviation | Spatial sky 16325A emission deviations (filled: sky, open: star) | Spatial sky continuum emission | Spatial sky telluric CO2 absorption deviations (filled: H < 10) | |||||||||||||||||||||||
| 0 | 0 |
|
|
|
|
|
|
| IPAIR | NAME | SHIFT | NEWSHIFT | S/N | NAME | SHIFT | NEWSHIFT | S/N |
| 0 | 05240047 | 0.501609 | 0.00000 | 19.1945 | 05240045 | 0.00150433 | 0.500105 | 19.1797 |
| 1 | 05240046 | 0.498529 | 0.00308004 | 19.2091 | 05240048 | 0.00551421 | 0.496095 | 19.2064 |
| 2 | 05240043 | 0.497757 | 0.00385204 | 19.1608 | 05240044 | 0.00373663 | 0.497872 | 19.1497 |
| 3 | 05240042 | 0.498049 | 0.00356004 | 19.1146 | 05240041 | 0.00000 | 0.501609 | 19.1110 |