| Red | Green | Blue | |
| z | 17.64 | ||
| znorm | Inf | ||
| sky | -Inf | -Inf | -Inf |
| S/N | 27.6 | 48.4 | 52.1 |
| S/N(c) | 0.0 | 0.0 | 0.0 |
| SN(E/C) |
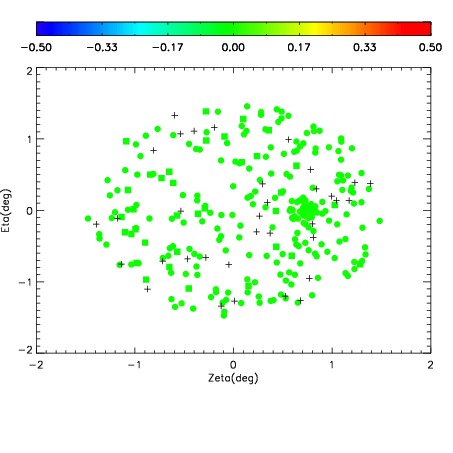

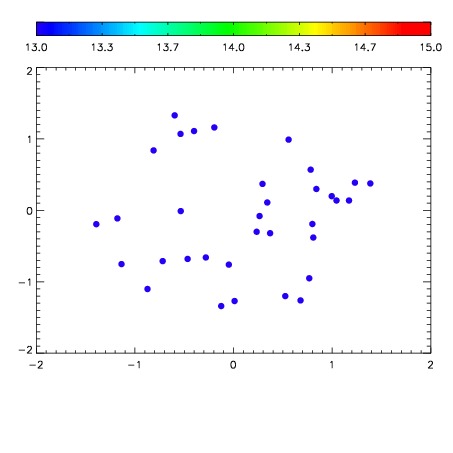

| Frame | Nreads | Zeropoints | Mag plots | Spatial mag deviation | Spatial sky 16325A emission deviations (filled: sky, open: star) | Spatial sky continuum emission | Spatial sky telluric CO2 absorption deviations (filled: H < 10) | |||||||||||||||||||||||
| 0 | 0 |
|
|
|
|
|
|
| IPAIR | NAME | SHIFT | NEWSHIFT | S/N | NAME | SHIFT | NEWSHIFT | S/N |
| 0 | 05440032 | 0.483598 | 0.00000 | 19.0501 | 05440029 | -0.00112701 | 0.484725 | 19.0403 |
| 1 | 05440031 | 0.483305 | 0.000292987 | 19.0689 | 05440030 | -0.000662193 | 0.484260 | 19.0578 |
| 2 | 05440028 | 0.481386 | 0.00221199 | 19.0123 | 05440033 | -0.00202527 | 0.485623 | 19.0124 |
| 3 | 05440027 | 0.481362 | 0.00223601 | 18.9092 | 05440026 | 0.00000 | 0.483598 | 18.8848 |