| Red | Green | Blue | |
| z | 17.64 | ||
| znorm | Inf | ||
| sky | -NaN | -Inf | -Inf |
| S/N | 25.8 | 45.3 | 47.8 |
| S/N(c) | 0.0 | 0.0 | 0.0 |
| SN(E/C) |

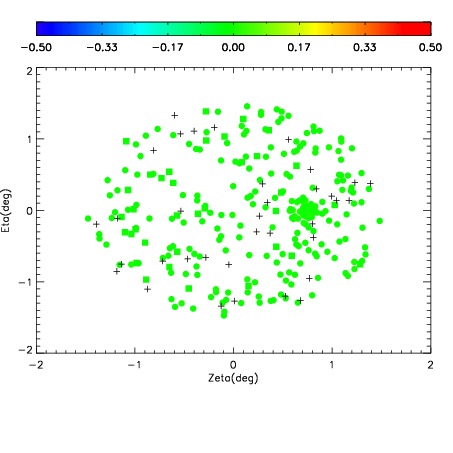

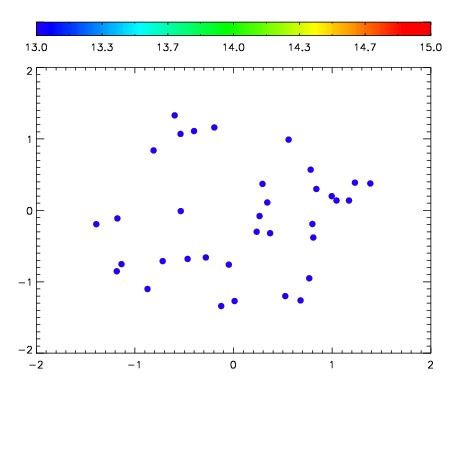

| Frame | Nreads | Zeropoints | Mag plots | Spatial mag deviation | Spatial sky 16325A emission deviations (filled: sky, open: star) | Spatial sky continuum emission | Spatial sky telluric CO2 absorption deviations (filled: H < 10) | |||||||||||||||||||||||
| 0 | 0 |
|
|
|
|
|
|
| IPAIR | NAME | SHIFT | NEWSHIFT | S/N | NAME | SHIFT | NEWSHIFT | S/N |
| 0 | 08400061 | 0.510667 | 0.00000 | 18.8673 | 08400063 | 0.00165386 | 0.509013 | 18.9066 |
| 1 | 08400065 | 0.509992 | 0.000675023 | 18.9656 | 08400066 | 0.00242017 | 0.508247 | 19.0124 |
| 2 | 08400064 | 0.509210 | 0.00145704 | 18.9442 | 08400062 | 0.00276162 | 0.507905 | 18.9507 |
| 3 | 08400060 | 0.510359 | 0.000308037 | 18.7903 | 08400059 | 0.00000 | 0.510667 | 18.7211 |