| Red | Green | Blue | |
| z | 17.65 | ||
| znorm | Inf | ||
| sky | -Inf | -Inf | -Inf |
| S/N | 12.2 | 24.2 | 25.6 |
| S/N(c) | 0.0 | 0.0 | 0.0 |
| SN(E/C) |
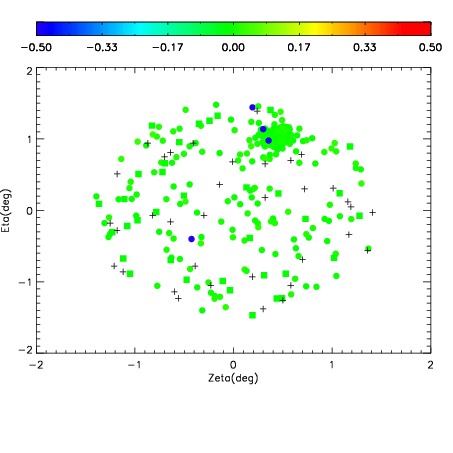
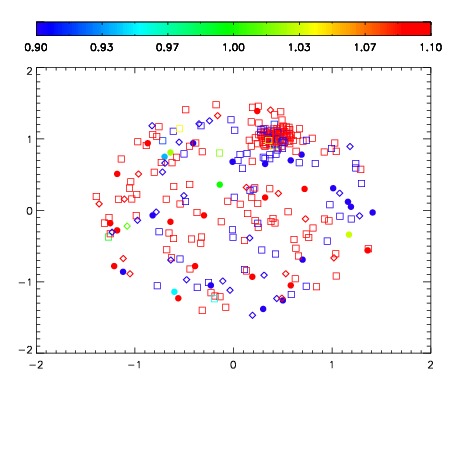
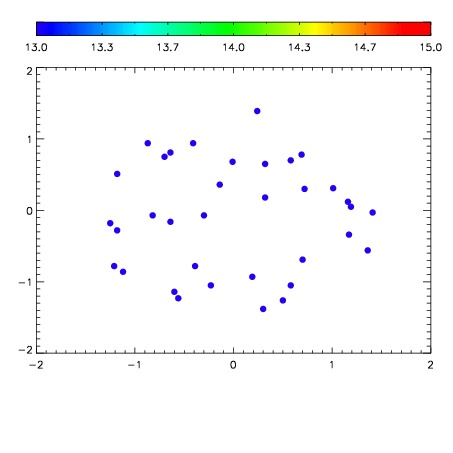

| Frame | Nreads | Zeropoints | Mag plots | Spatial mag deviation | Spatial sky 16325A emission deviations (filled: sky, open: star) | Spatial sky continuum emission | Spatial sky telluric CO2 absorption deviations (filled: H < 10) | |||||||||||||||||||||||
| 0 | 0 |
|
|
|
|
|
|
| IPAIR | NAME | SHIFT | NEWSHIFT | S/N | NAME | SHIFT | NEWSHIFT | S/N |
| 0 | 04040097 | 0.503791 | 0.00000 | 17.2593 | 04040099 | 0.00131601 | 0.502475 | 17.0581 |
| 1 | 04040105 | 0.501137 | 0.00265396 | 18.4161 | 04040106 | 0.00267369 | 0.501117 | 18.7302 |
| 2 | 04040104 | 0.500706 | 0.00308496 | 17.7669 | 04040103 | 0.00331627 | 0.500475 | 17.1203 |
| 3 | 04040101 | 0.503079 | 0.000711977 | 17.1173 | 04040102 | 0.00280553 | 0.500985 | 16.8741 |
| 4 | 04040100 | 0.501169 | 0.00262195 | 16.4411 | 04040098 | 0.00291645 | 0.500875 | 16.3919 |
| 5 | 04040096 | 0.503313 | 0.000477970 | 16.1108 | 04040095 | 0.00000 | 0.503791 | 16.3425 |