| Red | Green | Blue | |
| z | 17.64 | ||
| znorm | Inf | ||
| sky | -Inf | -Inf | -NaN |
| S/N | 20.5 | 36.3 | 39.3 |
| S/N(c) | 0.0 | 0.0 | 0.0 |
| SN(E/C) |
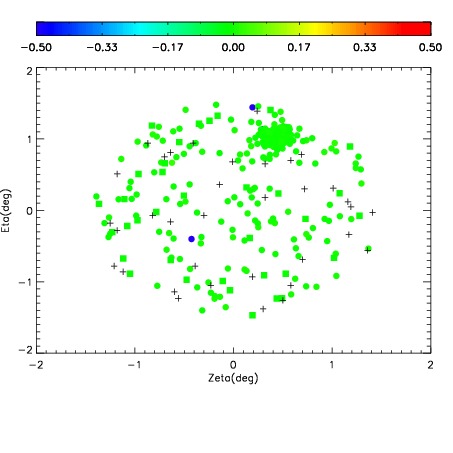
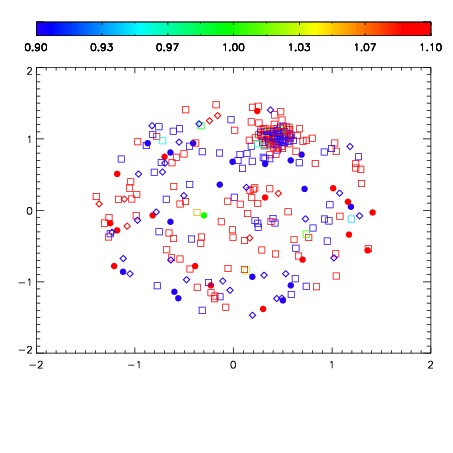
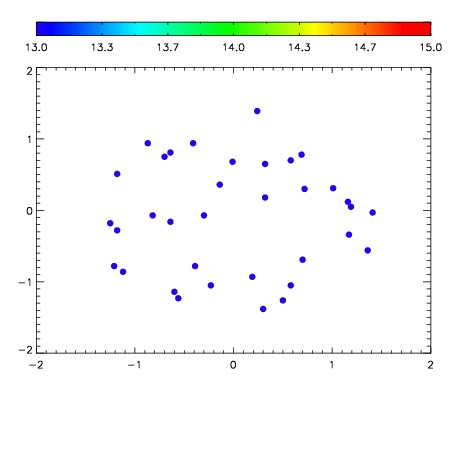

| Frame | Nreads | Zeropoints | Mag plots | Spatial mag deviation | Spatial sky 16325A emission deviations (filled: sky, open: star) | Spatial sky continuum emission | Spatial sky telluric CO2 absorption deviations (filled: H < 10) | |||||||||||||||||||||||
| 0 | 0 |
|
|
|
|
|
|
| IPAIR | NAME | SHIFT | NEWSHIFT | S/N | NAME | SHIFT | NEWSHIFT | S/N |
| 0 | 04620029 | 0.497254 | 0.00000 | 18.4175 | 04620034 | 0.00179018 | 0.495464 | 18.6421 |
| 1 | 04620032 | 0.494578 | 0.00267601 | 18.7199 | 04620031 | 0.00236596 | 0.494888 | 18.8904 |
| 2 | 04620033 | 0.495333 | 0.00192103 | 18.6999 | 04620030 | 0.00127610 | 0.495978 | 18.8010 |
| 3 | 04620028 | 0.494718 | 0.00253603 | 17.0379 | 04620027 | 0.00000 | 0.497254 | 18.5400 |