| Red | Green | Blue | |
| z | 17.64 | ||
| znorm | Inf | ||
| sky | -Inf | -Inf | -Inf |
| S/N | 25.6 | 44.1 | 48.2 |
| S/N(c) | 0.0 | 0.0 | 0.0 |
| SN(E/C) |
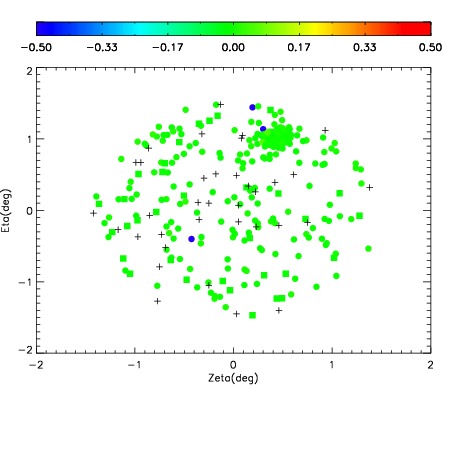
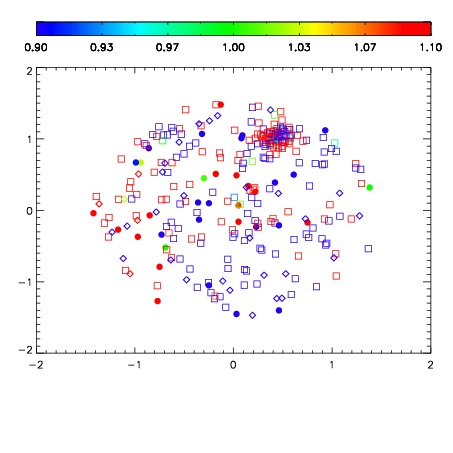


| Frame | Nreads | Zeropoints | Mag plots | Spatial mag deviation | Spatial sky 16325A emission deviations (filled: sky, open: star) | Spatial sky continuum emission | Spatial sky telluric CO2 absorption deviations (filled: H < 10) | |||||||||||||||||||||||
| 0 | 0 |
|
|
|
|
|
|
| IPAIR | NAME | SHIFT | NEWSHIFT | S/N | NAME | SHIFT | NEWSHIFT | S/N |
| 0 | 04050099 | 0.501145 | 0.00000 | 19.0010 | 04050101 | 0.000150207 | 0.500995 | 19.0160 |
| 1 | 04050102 | 0.499597 | 0.00154799 | 18.9896 | 04050100 | 0.00103610 | 0.500109 | 19.0027 |
| 2 | 04050098 | 0.500653 | 0.000491977 | 18.9767 | 04050097 | 0.00000 | 0.501145 | 18.8864 |
| 3 | 04050103 | 0.500455 | 0.000689983 | 18.9363 | 04050104 | 0.00313884 | 0.498006 | 18.8675 |