| Red | Green | Blue | |
| z | 17.64 | ||
| znorm | Inf | ||
| sky | -NaN | -NaN | -Inf |
| S/N | 30.0 | 52.6 | 56.5 |
| S/N(c) | 0.0 | 0.0 | 0.0 |
| SN(E/C) |
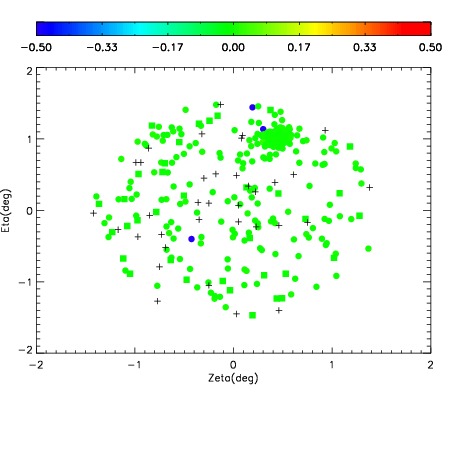
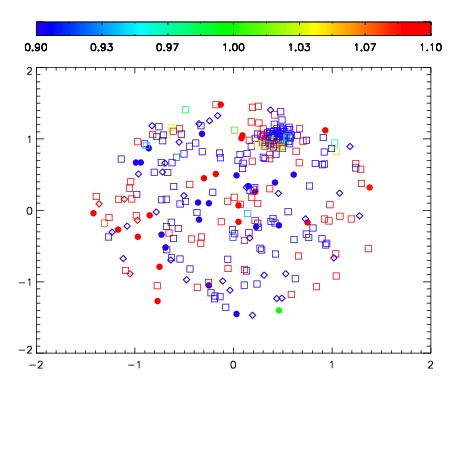


| Frame | Nreads | Zeropoints | Mag plots | Spatial mag deviation | Spatial sky 16325A emission deviations (filled: sky, open: star) | Spatial sky continuum emission | Spatial sky telluric CO2 absorption deviations (filled: H < 10) | |||||||||||||||||||||||
| 0 | 0 |
|
|
|
|
|
|
| IPAIR | NAME | SHIFT | NEWSHIFT | S/N | NAME | SHIFT | NEWSHIFT | S/N |
| 0 | 04890053 | 0.494335 | 0.00000 | 19.0849 | 04890054 | 0.00974933 | 0.484586 | 19.1071 |
| 1 | 04890056 | 0.493421 | 0.000914007 | 19.0948 | 04890058 | 0.00403744 | 0.490298 | 19.1107 |
| 2 | 04890057 | 0.494090 | 0.000245005 | 19.0824 | 04890055 | 0.00722545 | 0.487110 | 19.0589 |
| 3 | 04890052 | 0.493820 | 0.000514984 | 19.0560 | 04890051 | 0.00000 | 0.494335 | 19.0169 |