| Red | Green | Blue | |
| z | 17.64 | ||
| znorm | Inf | ||
| sky | -Inf | -Inf | -Inf |
| S/N | 24.5 | 43.9 | 47.3 |
| S/N(c) | 0.0 | 0.0 | 0.0 |
| SN(E/C) |

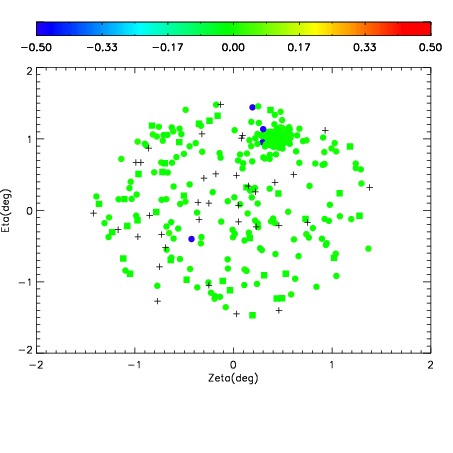

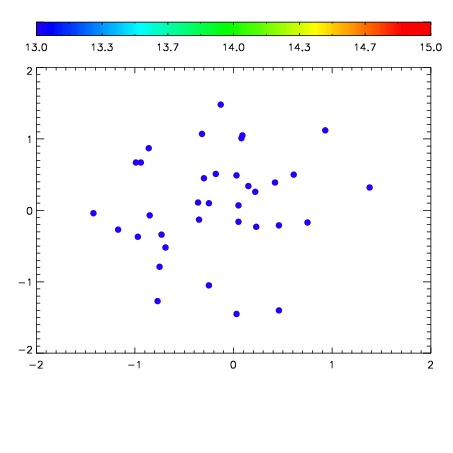

| Frame | Nreads | Zeropoints | Mag plots | Spatial mag deviation | Spatial sky 16325A emission deviations (filled: sky, open: star) | Spatial sky continuum emission | Spatial sky telluric CO2 absorption deviations (filled: H < 10) | |||||||||||||||||||||||
| 0 | 0 |
|
|
|
|
|
|
| IPAIR | NAME | SHIFT | NEWSHIFT | S/N | NAME | SHIFT | NEWSHIFT | S/N |
| 0 | 05180028 | 0.497223 | 0.00000 | 18.9181 | 05180029 | 0.00227207 | 0.494951 | 18.8858 |
| 1 | 05180023 | 0.494650 | 0.00257298 | 19.0238 | 05180025 | -0.000641205 | 0.497864 | 19.0473 |
| 2 | 05180024 | 0.495346 | 0.00187698 | 18.9660 | 05180026 | 0.000983840 | 0.496239 | 19.0273 |
| 3 | 05180027 | 0.495697 | 0.00152600 | 18.9631 | 05180022 | 0.00000 | 0.497223 | 18.9838 |