| Red | Green | Blue | |
| z | 17.64 | ||
| znorm | Inf | ||
| sky | -NaN | -NaN | -NaN |
| S/N | 31.3 | 50.9 | 53.0 |
| S/N(c) | 0.0 | 0.0 | 0.0 |
| SN(E/C) |


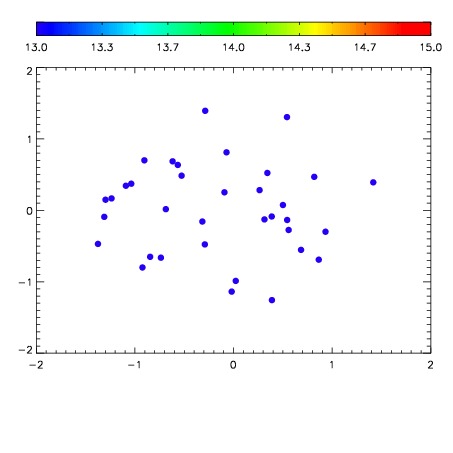

| Frame | Nreads | Zeropoints | Mag plots | Spatial mag deviation | Spatial sky 16325A emission deviations (filled: sky, open: star) | Spatial sky continuum emission | Spatial sky telluric CO2 absorption deviations (filled: H < 10) | |||||||||||||||||||||||
| 0 | 0 |
|
|
|
|
|
|
| IPAIR | NAME | SHIFT | NEWSHIFT | S/N | NAME | SHIFT | NEWSHIFT | S/N |
| 0 | 04610023 | 0.498165 | 0.00000 | 19.1727 | 04610028 | 0.00356364 | 0.494601 | 19.1787 |
| 1 | 04610026 | 0.493016 | 0.00514901 | 19.1898 | 04610025 | 0.000977452 | 0.497188 | 19.2136 |
| 2 | 04610027 | 0.497540 | 0.000625014 | 19.1807 | 04610024 | 0.000805972 | 0.497359 | 19.1998 |
| 3 | 04610022 | 0.495529 | 0.00263602 | 19.0848 | 04610021 | 0.00000 | 0.498165 | 19.1151 |