| Red | Green | Blue | |
| z | 17.64 | ||
| znorm | Inf | ||
| sky | -Inf | -NaN | -NaN |
| S/N | 28.1 | 48.3 | 49.9 |
| S/N(c) | 0.0 | 0.0 | 0.0 |
| SN(E/C) |


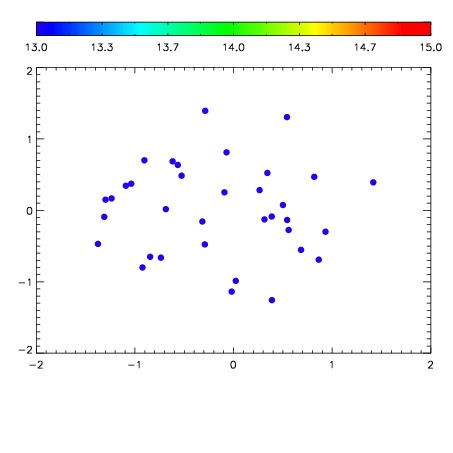

| Frame | Nreads | Zeropoints | Mag plots | Spatial mag deviation | Spatial sky 16325A emission deviations (filled: sky, open: star) | Spatial sky continuum emission | Spatial sky telluric CO2 absorption deviations (filled: H < 10) | |||||||||||||||||||||||
| 0 | 0 |
|
|
|
|
|
|
| IPAIR | NAME | SHIFT | NEWSHIFT | S/N | NAME | SHIFT | NEWSHIFT | S/N |
| 0 | 04670042 | 0.496491 | 0.00000 | 18.9156 | 04670043 | -0.00104164 | 0.497533 | 18.8309 |
| 1 | 04670038 | 0.494591 | 0.00189999 | 18.9798 | 04670039 | 0.00196865 | 0.494522 | 18.9151 |
| 2 | 04670037 | 0.494323 | 0.00216800 | 18.9504 | 04670040 | 0.000819027 | 0.495672 | 18.8865 |
| 3 | 04670041 | 0.496370 | 0.000120997 | 18.8043 | 04670036 | 0.00000 | 0.496491 | 18.8010 |