| Red | Green | Blue | |
| z | 17.64 | ||
| znorm | Inf | ||
| sky | -NaN | -NaN | -NaN |
| S/N | 27.8 | 48.1 | 52.3 |
| S/N(c) | 0.0 | 0.0 | 0.0 |
| SN(E/C) |
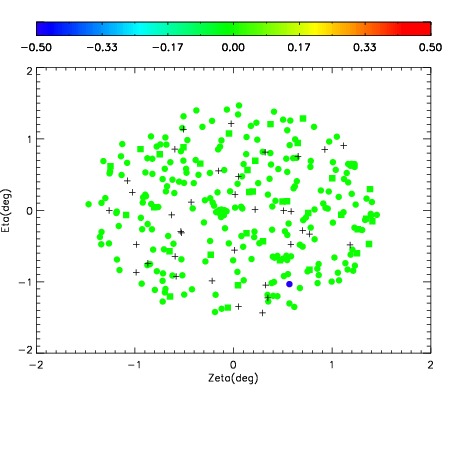
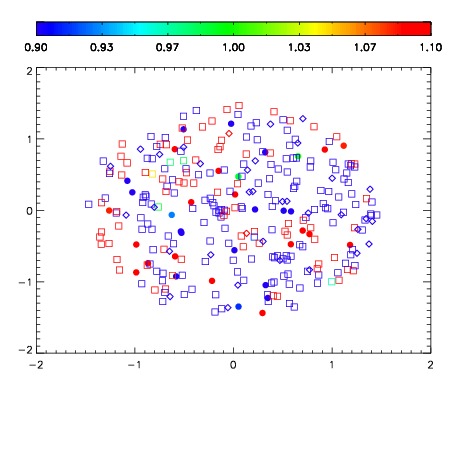


| Frame | Nreads | Zeropoints | Mag plots | Spatial mag deviation | Spatial sky 16325A emission deviations (filled: sky, open: star) | Spatial sky continuum emission | Spatial sky telluric CO2 absorption deviations (filled: H < 10) | |||||||||||||||||||||||
| 0 | 0 |
|
|
|
|
|
|
| IPAIR | NAME | SHIFT | NEWSHIFT | S/N | NAME | SHIFT | NEWSHIFT | S/N |
| 0 | 04620040 | 0.494794 | 0.00000 | 18.6790 | 04620041 | 0.00231550 | 0.492479 | 18.7696 |
| 1 | 04620043 | 0.491556 | 0.00323802 | 19.0806 | 04620045 | -0.00110182 | 0.495896 | 19.0538 |
| 2 | 04620044 | 0.492744 | 0.00205001 | 19.0305 | 04620046 | -0.00216884 | 0.496963 | 19.0383 |
| 3 | 04620047 | 0.490828 | 0.00396600 | 19.0045 | 04620038 | 0.00000 | 0.494794 | 18.9929 |
| 4 | 04620039 | 0.494171 | 0.000623018 | 18.7021 | 04620042 | -0.000132667 | 0.494927 | 18.9814 |