| Red | Green | Blue | |
| z | 17.64 | ||
| znorm | Inf | ||
| sky | -NaN | -Inf | -Inf |
| S/N | 28.6 | 47.5 | 53.1 |
| S/N(c) | 0.0 | 0.0 | 0.0 |
| SN(E/C) |
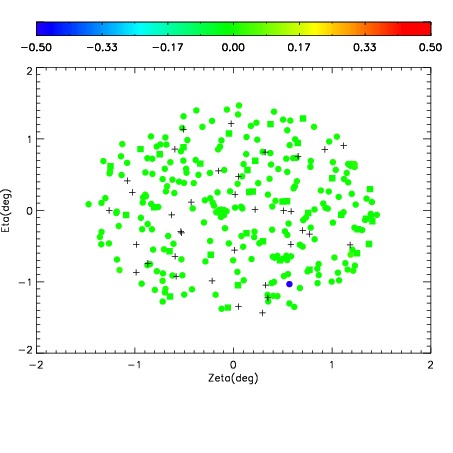
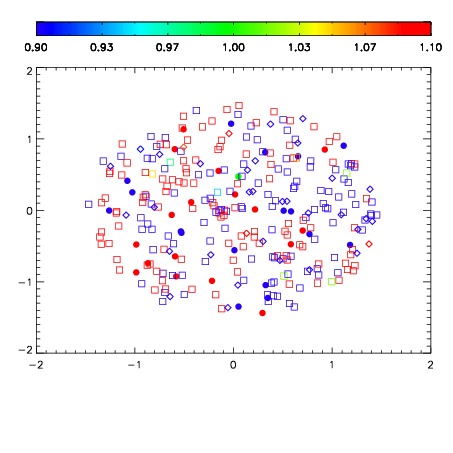
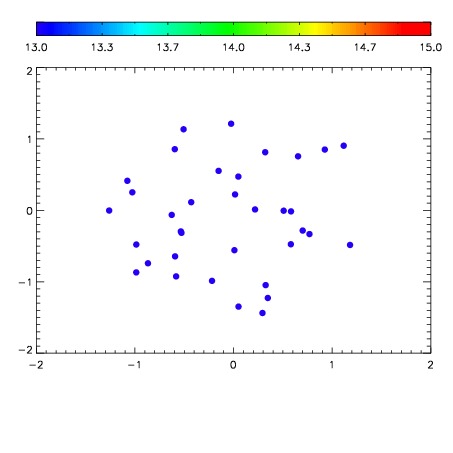

| Frame | Nreads | Zeropoints | Mag plots | Spatial mag deviation | Spatial sky 16325A emission deviations (filled: sky, open: star) | Spatial sky continuum emission | Spatial sky telluric CO2 absorption deviations (filled: H < 10) | |||||||||||||||||||||||
| 0 | 0 |
|
|
|
|
|
|
| IPAIR | NAME | SHIFT | NEWSHIFT | S/N | NAME | SHIFT | NEWSHIFT | S/N |
| 0 | 04890068 | 0.490154 | 0.00000 | 19.0806 | 04890069 | 0.00169498 | 0.488459 | 19.0828 |
| 1 | 04890064 | 0.489833 | 0.000321001 | 19.1265 | 04890065 | 0.000232343 | 0.489922 | 19.1264 |
| 2 | 04890063 | 0.489577 | 0.000577003 | 19.1258 | 04890066 | 6.35049e-05 | 0.490090 | 19.1137 |
| 3 | 04890067 | 0.489156 | 0.000997990 | 19.1154 | 04890062 | 0.00000 | 0.490154 | 19.1016 |