| Red | Green | Blue | |
| z | 17.64 | ||
| znorm | Inf | ||
| sky | -Inf | -NaN | -Inf |
| S/N | 16.9 | 32.3 | 35.8 |
| S/N(c) | 0.0 | 0.0 | 0.0 |
| SN(E/C) |
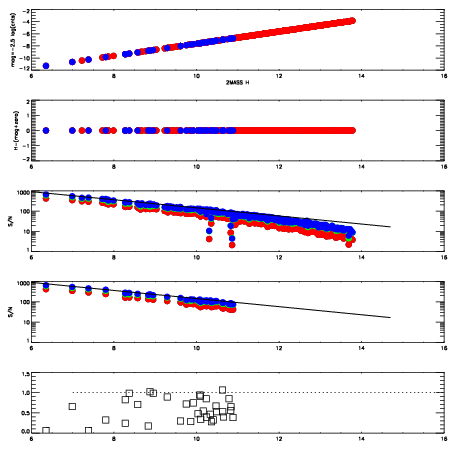
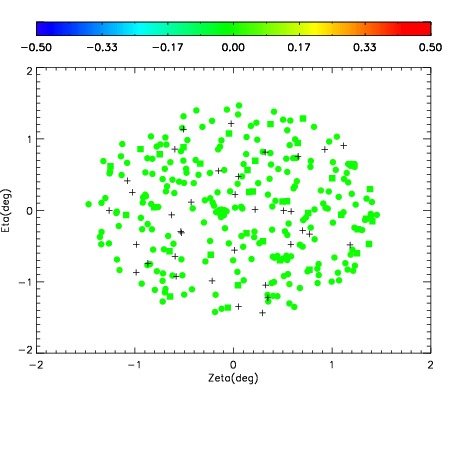


| Frame | Nreads | Zeropoints | Mag plots | Spatial mag deviation | Spatial sky 16325A emission deviations (filled: sky, open: star) | Spatial sky continuum emission | Spatial sky telluric CO2 absorption deviations (filled: H < 10) | |||||||||||||||||||||||
| 0 | 0 |
|
|
|
|
|
|
| IPAIR | NAME | SHIFT | NEWSHIFT | S/N | NAME | SHIFT | NEWSHIFT | S/N |
| 0 | 07880049 | 0.474578 | 0.00000 | 17.8354 | 07880043 | 0.00404259 | 0.470535 | 17.8627 |
| 1 | 07880041 | 0.472092 | 0.00248599 | 18.4676 | 07880046 | 0.00533516 | 0.469243 | 18.3187 |
| 2 | 07880044 | 0.472723 | 0.00185499 | 18.3360 | 07880042 | 0.00371265 | 0.470865 | 18.2331 |
| 3 | 07880045 | 0.472742 | 0.00183600 | 18.3144 | 07880050 | 0.00527549 | 0.469303 | 18.1031 |
| 4 | 07880040 | 0.472445 | 0.00213298 | 18.0959 | 07880047 | 0.00468675 | 0.469891 | 18.0666 |
| 5 | 07880048 | 0.474135 | 0.000442982 | 18.0593 | 07880039 | 0.00000 | 0.474578 | 17.9029 |