| Red | Green | Blue | |
| z | 17.64 | ||
| znorm | Inf | ||
| sky | -Inf | -Inf | -NaN |
| S/N | 23.3 | 38.9 | 40.1 |
| S/N(c) | 0.0 | 0.0 | 0.0 |
| SN(E/C) |
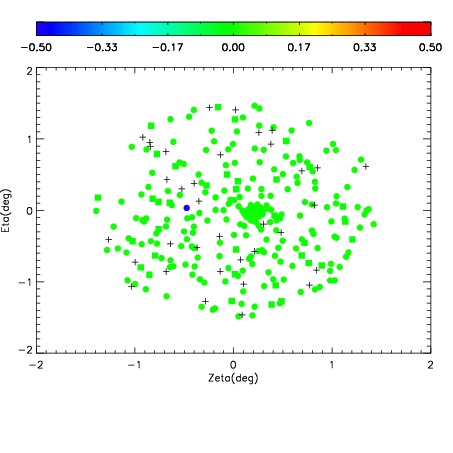
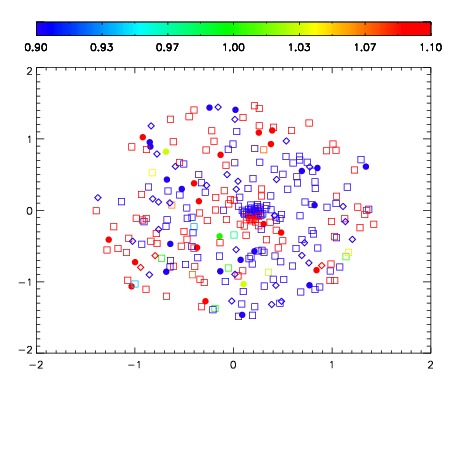
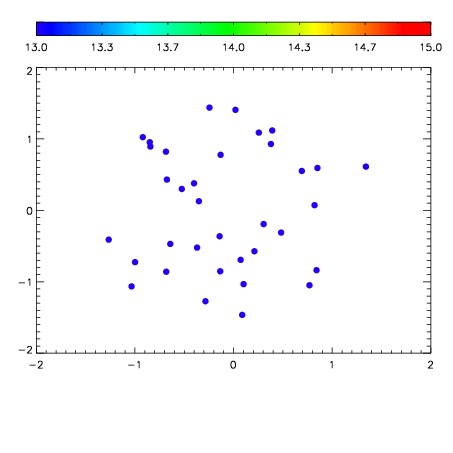

| Frame | Nreads | Zeropoints | Mag plots | Spatial mag deviation | Spatial sky 16325A emission deviations (filled: sky, open: star) | Spatial sky continuum emission | Spatial sky telluric CO2 absorption deviations (filled: H < 10) | |||||||||||||||||||||||
| 0 | 0 |
|
|
|
|
|
|
| IPAIR | NAME | SHIFT | NEWSHIFT | S/N | NAME | SHIFT | NEWSHIFT | S/N |
| 0 | 04300042 | 0.494532 | 0.00000 | 18.7682 | 04300043 | 0.000419679 | 0.494112 | 19.1012 |
| 1 | 04300037 | 0.492916 | 0.00161600 | 18.6385 | 04300039 | 0.00144542 | 0.493087 | 18.9685 |
| 2 | 04300038 | 0.494224 | 0.000307977 | 18.4546 | 04300040 | -0.00107551 | 0.495607 | 18.9660 |
| 3 | 04300041 | 0.492291 | 0.00224099 | 16.5747 | 04300036 | 0.00000 | 0.494532 | 18.8580 |