| Red | Green | Blue | |
| z | 17.64 | ||
| znorm | Inf | ||
| sky | -Inf | -Inf | -Inf |
| S/N | 37.9 | 62.6 | 67.0 |
| S/N(c) | 0.0 | 0.0 | 0.0 |
| SN(E/C) |
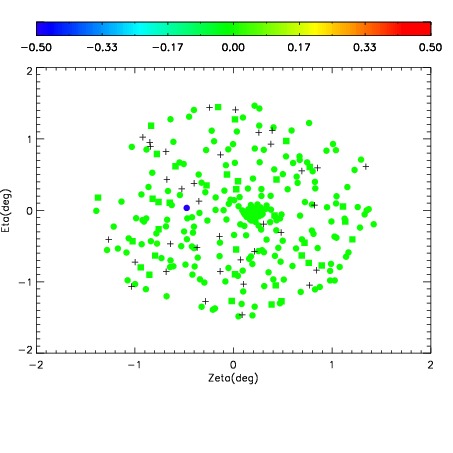

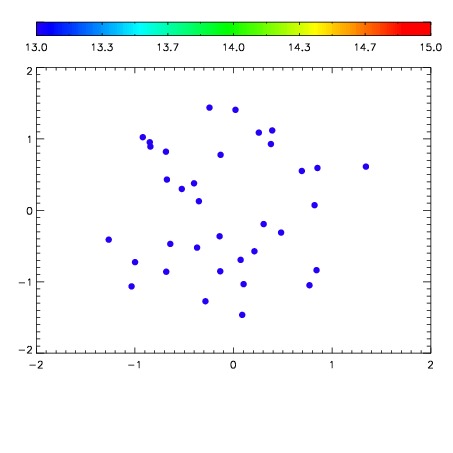

| Frame | Nreads | Zeropoints | Mag plots | Spatial mag deviation | Spatial sky 16325A emission deviations (filled: sky, open: star) | Spatial sky continuum emission | Spatial sky telluric CO2 absorption deviations (filled: H < 10) | |||||||||||||||||||||||
| 0 | 0 |
|
|
|
|
|
|
| IPAIR | NAME | SHIFT | NEWSHIFT | S/N | NAME | SHIFT | NEWSHIFT | S/N |
| 0 | 04370049 | 0.497548 | 0.00000 | 19.2060 | 04370047 | 0.00000 | 0.497548 | 19.2179 |
| 1 | 04370056 | 0.492447 | 0.00510103 | 19.2439 | 04370054 | 0.000428585 | 0.497119 | 19.2398 |
| 2 | 04370053 | 0.493837 | 0.00371101 | 19.2172 | 04370051 | -0.000647173 | 0.498195 | 19.2331 |
| 3 | 04370048 | 0.495397 | 0.00215101 | 19.2064 | 04370055 | -0.00113013 | 0.498678 | 19.2329 |
| 4 | 04370052 | 0.491605 | 0.00594300 | 19.1939 | 04370050 | 0.00123509 | 0.496313 | 19.2108 |