| Red | Green | Blue | |
| z | 17.64 | ||
| znorm | Inf | ||
| sky | -Inf | -NaN | -Inf |
| S/N | 32.1 | 54.6 | 58.2 |
| S/N(c) | 0.0 | 0.0 | 0.0 |
| SN(E/C) |
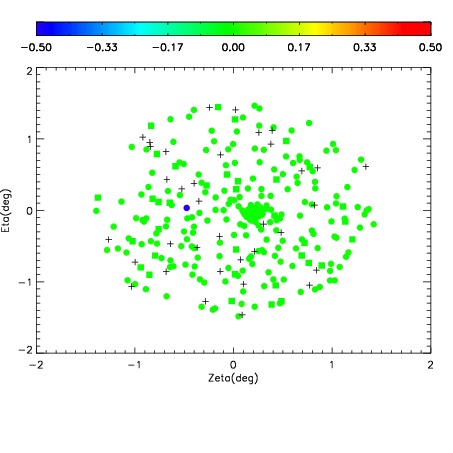
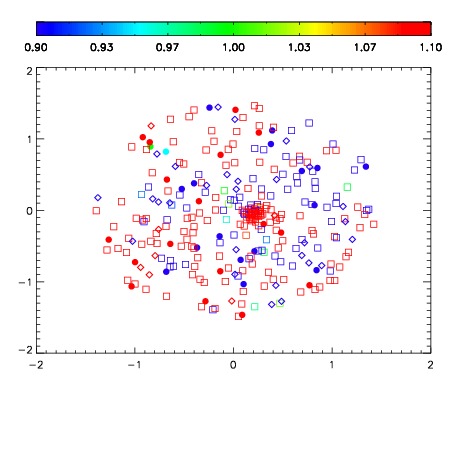


| Frame | Nreads | Zeropoints | Mag plots | Spatial mag deviation | Spatial sky 16325A emission deviations (filled: sky, open: star) | Spatial sky continuum emission | Spatial sky telluric CO2 absorption deviations (filled: H < 10) | |||||||||||||||||||||||
| 0 | 0 |
|
|
|
|
|
|
| IPAIR | NAME | SHIFT | NEWSHIFT | S/N | NAME | SHIFT | NEWSHIFT | S/N |
| 0 | 04600071 | 0.499556 | 0.00000 | 19.1771 | 04600073 | -0.000506923 | 0.500063 | 19.1443 |
| 1 | 04600074 | 0.495887 | 0.00366899 | 19.1870 | 04600076 | 0.00143454 | 0.498121 | 19.2389 |
| 2 | 04600075 | 0.499341 | 0.000214994 | 19.1848 | 04600069 | 0.00000 | 0.499556 | 19.1730 |
| 3 | 04600070 | 0.495851 | 0.00370499 | 19.1554 | 04600072 | 0.000837455 | 0.498719 | 19.0933 |