| Red | Green | Blue | |
| z | 17.64 | ||
| znorm | Inf | ||
| sky | -Inf | -NaN | -Inf |
| S/N | 31.4 | 53.7 | 56.9 |
| S/N(c) | 0.0 | 0.0 | 0.0 |
| SN(E/C) |
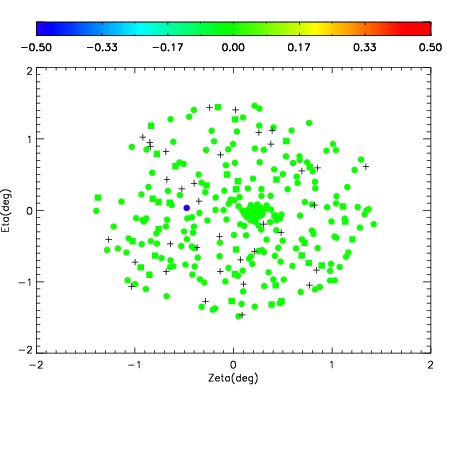
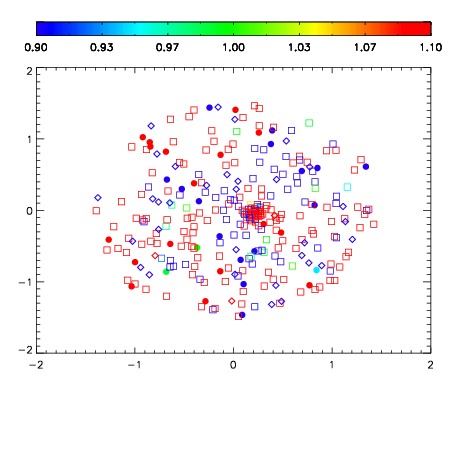
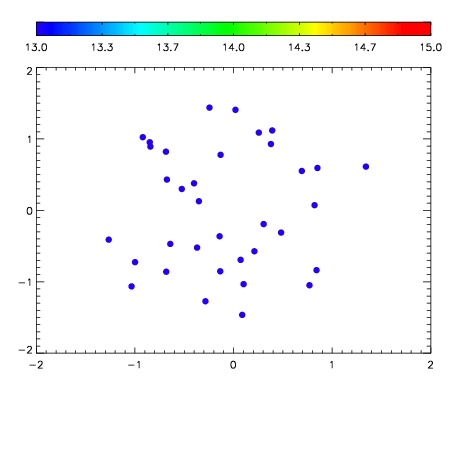

| Frame | Nreads | Zeropoints | Mag plots | Spatial mag deviation | Spatial sky 16325A emission deviations (filled: sky, open: star) | Spatial sky continuum emission | Spatial sky telluric CO2 absorption deviations (filled: H < 10) | |||||||||||||||||||||||
| 0 | 0 |
|
|
|
|
|
|
| IPAIR | NAME | SHIFT | NEWSHIFT | S/N | NAME | SHIFT | NEWSHIFT | S/N |
| 0 | 04610012 | 0.505453 | 0.00000 | 19.0935 | 04610013 | 0.00196175 | 0.503491 | 19.1074 |
| 1 | 04610016 | 0.495494 | 0.00995898 | 19.1731 | 04610017 | -0.000565743 | 0.506019 | 19.1958 |
| 2 | 04610015 | 0.495233 | 0.0102200 | 19.1605 | 04610014 | -6.83939e-05 | 0.505521 | 19.1428 |
| 3 | 04610011 | 0.495366 | 0.0100870 | 19.0848 | 04610010 | 0.00000 | 0.505453 | 19.0882 |