| Red | Green | Blue | |
| z | 17.64 | ||
| znorm | Inf | ||
| sky | -NaN | -NaN | -Inf |
| S/N | 26.9 | 45.9 | 49.8 |
| S/N(c) | 0.0 | 0.0 | 0.0 |
| SN(E/C) |
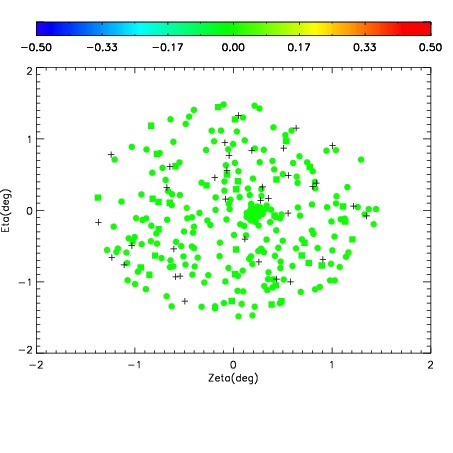
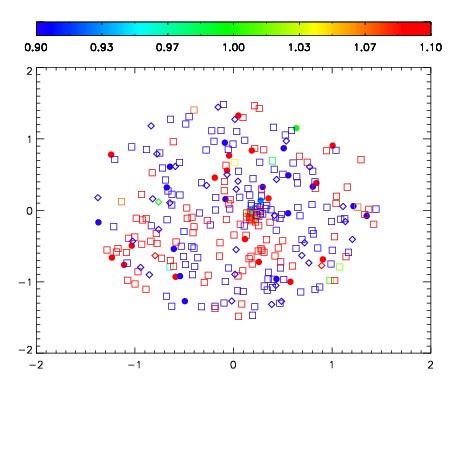


| Frame | Nreads | Zeropoints | Mag plots | Spatial mag deviation | Spatial sky 16325A emission deviations (filled: sky, open: star) | Spatial sky continuum emission | Spatial sky telluric CO2 absorption deviations (filled: H < 10) | |||||||||||||||||||||||
| 0 | 0 |
|
|
|
|
|
|
| IPAIR | NAME | SHIFT | NEWSHIFT | S/N | NAME | SHIFT | NEWSHIFT | S/N |
| 0 | 04860061 | 0.498039 | 0.00000 | 19.1475 | 04860060 | 0.00000 | 0.498039 | 19.1277 |
| 1 | 04860062 | 0.497386 | 0.000652999 | 19.1786 | 04860064 | -0.000829722 | 0.498869 | 19.1446 |
| 2 | 04860065 | 0.497659 | 0.000380009 | 19.1627 | 04860063 | -0.000120804 | 0.498160 | 19.1332 |