| Red | Green | Blue | |
| z | 17.64 | ||
| znorm | Inf | ||
| sky | -Inf | -NaN | -Inf |
| S/N | 31.1 | 53.4 | 57.7 |
| S/N(c) | 0.0 | 0.0 | 0.0 |
| SN(E/C) |
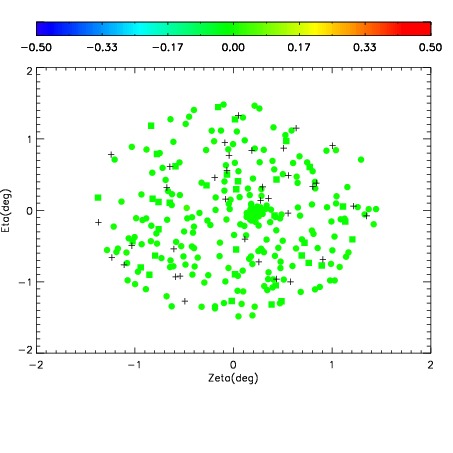
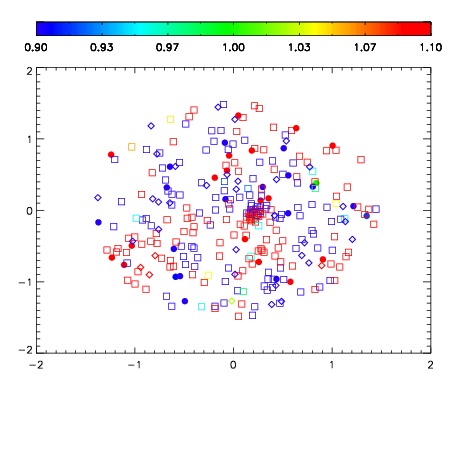


| Frame | Nreads | Zeropoints | Mag plots | Spatial mag deviation | Spatial sky 16325A emission deviations (filled: sky, open: star) | Spatial sky continuum emission | Spatial sky telluric CO2 absorption deviations (filled: H < 10) | |||||||||||||||||||||||
| 0 | 0 |
|
|
|
|
|
|
| IPAIR | NAME | SHIFT | NEWSHIFT | S/N | NAME | SHIFT | NEWSHIFT | S/N |
| 0 | 04870061 | 0.498896 | 0.00000 | 19.1905 | 04870062 | 9.22338e-06 | 0.498887 | 19.1557 |
| 1 | 04870060 | 0.498604 | 0.000292003 | 19.1674 | 04870063 | 0.00102884 | 0.497867 | 19.1487 |
| 2 | 04870064 | 0.497292 | 0.00160399 | 19.1259 | 04870059 | 0.00000 | 0.498896 | 19.1315 |
| 3 | 04870065 | 0.498524 | 0.000371993 | 19.0690 | 04870066 | 0.000557239 | 0.498339 | 19.1213 |