| Red | Green | Blue | |
| z | 17.64 | ||
| znorm | Inf | ||
| sky | -Inf | -NaN | -Inf |
| S/N | 21.2 | 37.5 | 39.1 |
| S/N(c) | 0.0 | 0.0 | 0.0 |
| SN(E/C) |
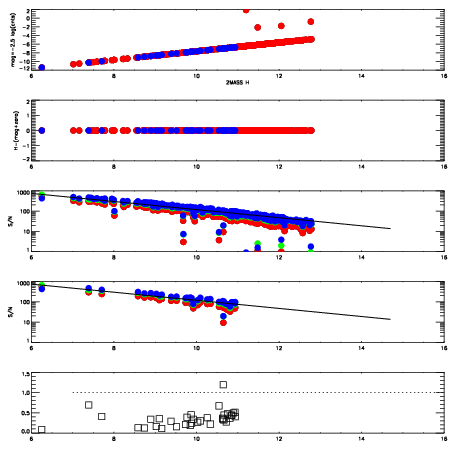
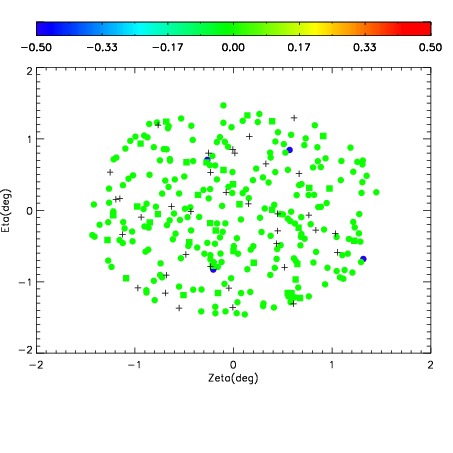
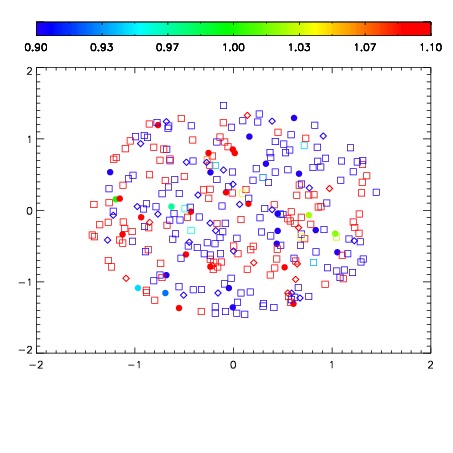
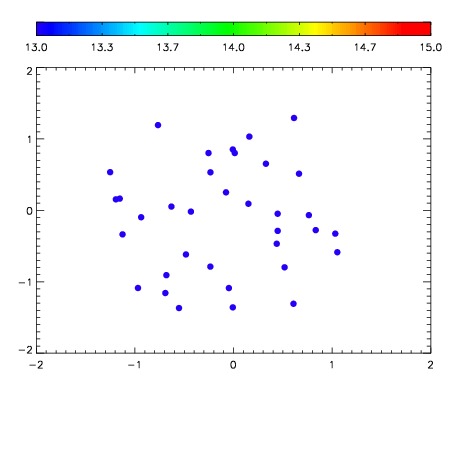

| Frame | Nreads | Zeropoints | Mag plots | Spatial mag deviation | Spatial sky 16325A emission deviations (filled: sky, open: star) | Spatial sky continuum emission | Spatial sky telluric CO2 absorption deviations (filled: H < 10) | |||||||||||||||||||||||
| 0 | 0 |
|
|
|
|
|
|
| IPAIR | NAME | SHIFT | NEWSHIFT | S/N | NAME | SHIFT | NEWSHIFT | S/N |
| 0 | 08770023 | 0.479747 | 0.00000 | 18.4209 | 08770024 | 0.00212128 | 0.477626 | 18.6494 |
| 1 | 08770027 | 0.478541 | 0.00120601 | 18.9753 | 08770028 | 0.00226398 | 0.477483 | 18.8967 |
| 2 | 08770026 | 0.477873 | 0.00187400 | 18.9255 | 08770025 | 0.00234205 | 0.477405 | 18.8198 |
| 3 | 08770022 | 0.479692 | 5.49853e-05 | 18.5241 | 08770021 | 0.00000 | 0.479747 | 18.7184 |