| Red | Green | Blue | |
| z | 17.64 | ||
| znorm | Inf | ||
| sky | -Inf | -NaN | -Inf |
| S/N | 25.4 | 44.2 | 46.7 |
| S/N(c) | 0.0 | 0.0 | 0.0 |
| SN(E/C) |

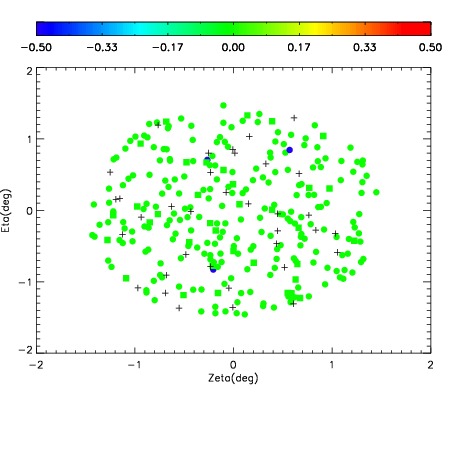
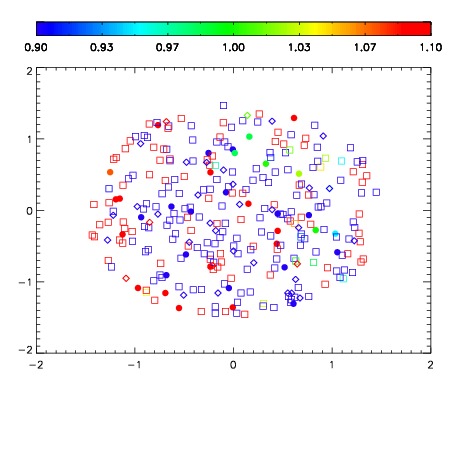
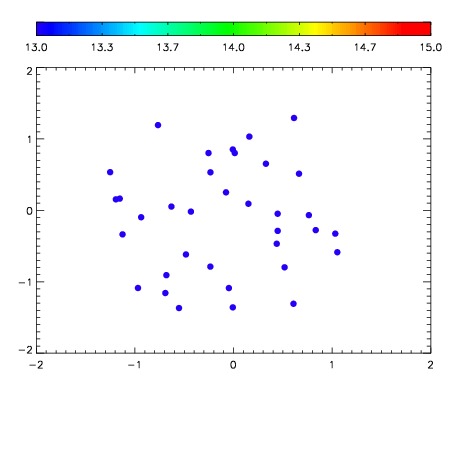

| Frame | Nreads | Zeropoints | Mag plots | Spatial mag deviation | Spatial sky 16325A emission deviations (filled: sky, open: star) | Spatial sky continuum emission | Spatial sky telluric CO2 absorption deviations (filled: H < 10) | |||||||||||||||||||||||
| 0 | 0 |
|
|
|
|
|
|
| IPAIR | NAME | SHIFT | NEWSHIFT | S/N | NAME | SHIFT | NEWSHIFT | S/N |
| 0 | 08990017 | 0.481152 | 0.00000 | 18.9556 | 08990014 | -0.00278523 | 0.483937 | 18.9019 |
| 1 | 08990013 | 0.478996 | 0.00215599 | 19.0120 | 08990018 | -0.000663649 | 0.481816 | 18.9998 |
| 2 | 08990016 | 0.480493 | 0.000658989 | 18.9835 | 08990011 | 0.00000 | 0.481152 | 18.9708 |
| 3 | 08990012 | 0.478421 | 0.00273100 | 18.9797 | 08990015 | -0.00237969 | 0.483532 | 18.9293 |