| Red | Green | Blue | |
| z | 17.64 | ||
| znorm | Inf | ||
| sky | -Inf | -Inf | -Inf |
| S/N | 22.8 | 40.2 | 43.8 |
| S/N(c) | 0.0 | 0.0 | 0.0 |
| SN(E/C) |
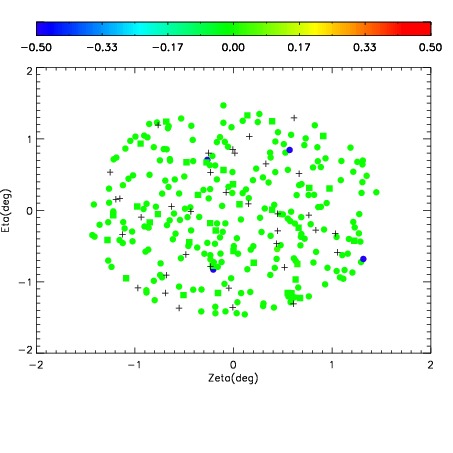
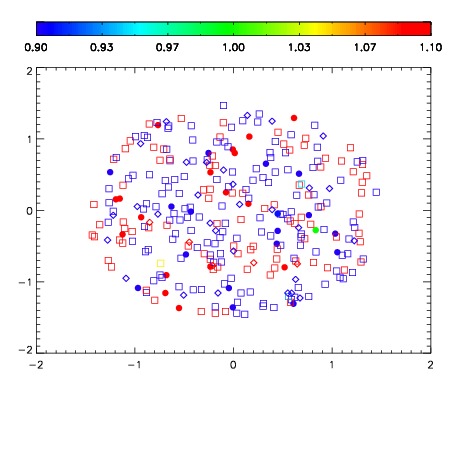
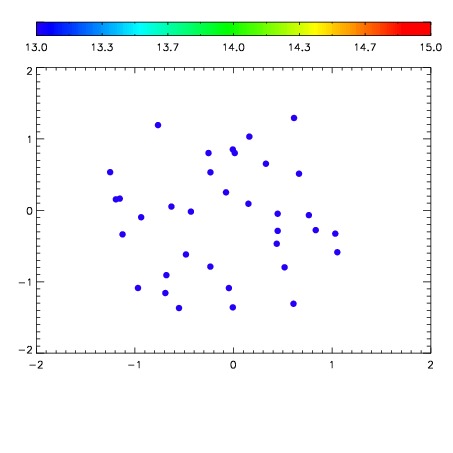

| Frame | Nreads | Zeropoints | Mag plots | Spatial mag deviation | Spatial sky 16325A emission deviations (filled: sky, open: star) | Spatial sky continuum emission | Spatial sky telluric CO2 absorption deviations (filled: H < 10) | |||||||||||||||||||||||
| 0 | 0 |
|
|
|
|
|
|
| IPAIR | NAME | SHIFT | NEWSHIFT | S/N | NAME | SHIFT | NEWSHIFT | S/N |
| 0 | 09060016 | 0.480919 | 0.00000 | 18.6876 | 09060014 | 0.00206764 | 0.478851 | 18.7238 |
| 1 | 09060017 | 0.480522 | 0.000396997 | 19.0406 | 09060018 | 0.00404188 | 0.476877 | 19.0344 |
| 2 | 09060012 | 0.476597 | 0.00432199 | 18.9526 | 09060011 | 0.00000 | 0.480919 | 18.8506 |
| 3 | 09060013 | 0.477317 | 0.00360200 | 18.9401 | 09060015 | 0.00222762 | 0.478691 | 18.7990 |