| Red | Green | Blue | |
| z | 17.64 | ||
| znorm | Inf | ||
| sky | -Inf | -Inf | -Inf |
| S/N | 20.9 | 39.1 | 40.8 |
| S/N(c) | 0.0 | 0.0 | 0.0 |
| SN(E/C) |
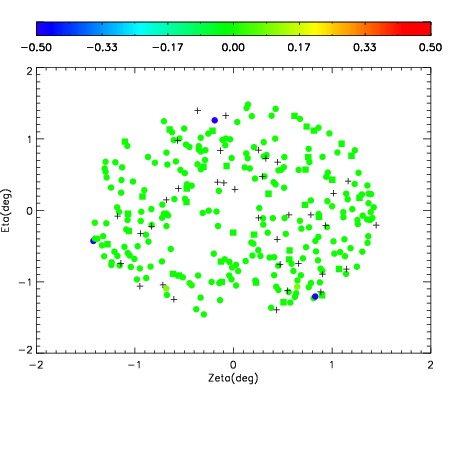
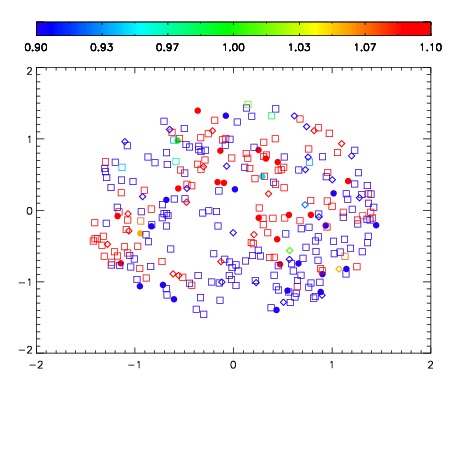
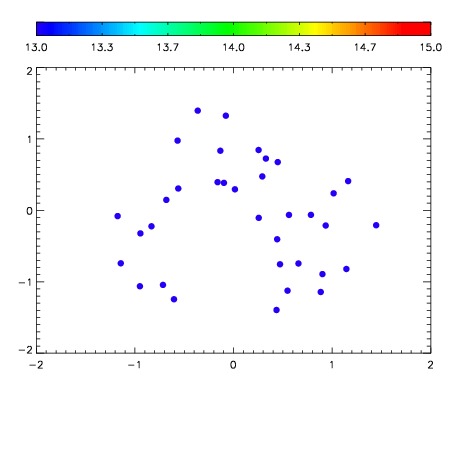

| Frame | Nreads | Zeropoints | Mag plots | Spatial mag deviation | Spatial sky 16325A emission deviations (filled: sky, open: star) | Spatial sky continuum emission | Spatial sky telluric CO2 absorption deviations (filled: H < 10) | |||||||||||||||||||||||
| 0 | 0 |
|
|
|
|
|
|
| IPAIR | NAME | SHIFT | NEWSHIFT | S/N | NAME | SHIFT | NEWSHIFT | S/N |
| 0 | 11390097 | 0.472332 | 0.00000 | 18.6446 | 11390088 | 0.00000 | 0.472332 | 18.6231 |
| 1 | 11390089 | 0.469796 | 0.00253600 | 18.7789 | 11390096 | -0.00276312 | 0.475095 | 18.7254 |
| 2 | 11390090 | 0.470298 | 0.00203401 | 18.6860 | 11390091 | -0.00412800 | 0.476460 | 18.6509 |
| 3 | 11390094 | 0.470662 | 0.00167000 | 18.1465 | 11390095 | -0.00373840 | 0.476070 | 18.5053 |
| 4 | 11390093 | 0.469580 | 0.00275201 | 18.1064 | 11390092 | -0.00407601 | 0.476408 | 18.3858 |