| Red | Green | Blue | |
| z | 17.64 | ||
| znorm | Inf | ||
| sky | -Inf | -Inf | -Inf |
| S/N | 15.2 | 29.5 | 30.4 |
| S/N(c) | 0.0 | 0.0 | 0.0 |
| SN(E/C) |
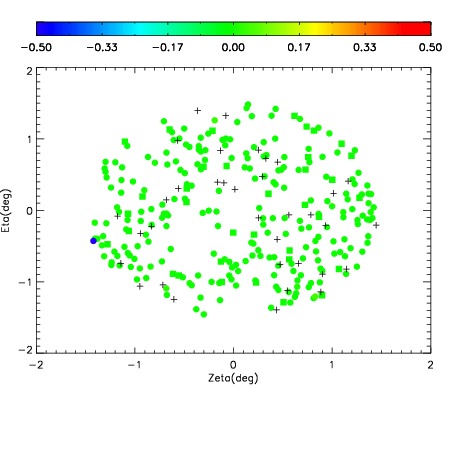
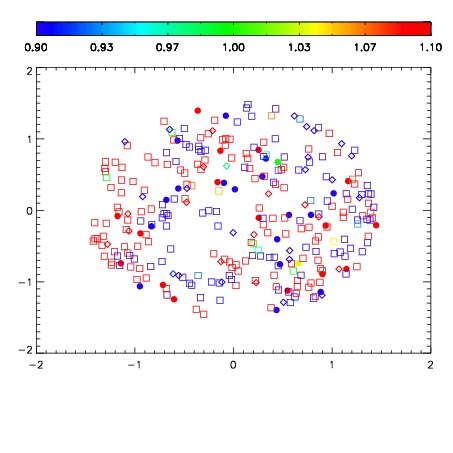
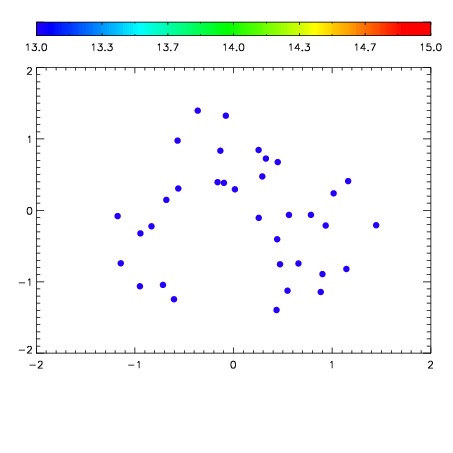

| Frame | Nreads | Zeropoints | Mag plots | Spatial mag deviation | Spatial sky 16325A emission deviations (filled: sky, open: star) | Spatial sky continuum emission | Spatial sky telluric CO2 absorption deviations (filled: H < 10) | |||||||||||||||||||||||
| 0 | 0 |
|
|
|
|
|
|
| IPAIR | NAME | SHIFT | NEWSHIFT | S/N | NAME | SHIFT | NEWSHIFT | S/N |
| 0 | 11430070 | 0.482997 | 0.00000 | 18.0614 | 11430065 | -0.000576970 | 0.483574 | 17.9739 |
| 1 | 11430062 | 0.482043 | 0.000954002 | 18.3646 | 11430061 | 0.00000 | 0.482997 | 18.3493 |
| 2 | 11430063 | 0.482605 | 0.000391990 | 18.2355 | 11430069 | -0.00103295 | 0.484030 | 18.3075 |
| 3 | 11430067 | 0.482717 | 0.000279993 | 18.0717 | 11430068 | -0.000934040 | 0.483931 | 17.9967 |
| 4 | 11430066 | 0.482722 | 0.000274986 | 18.0440 | 11430064 | -0.000306484 | 0.483303 | 17.8415 |