| Red | Green | Blue | |
| z | 17.64 | ||
| znorm | Inf | ||
| sky | -Inf | -Inf | -Inf |
| S/N | 25.9 | 43.6 | 48.0 |
| S/N(c) | 0.0 | 0.0 | 0.0 |
| SN(E/C) |
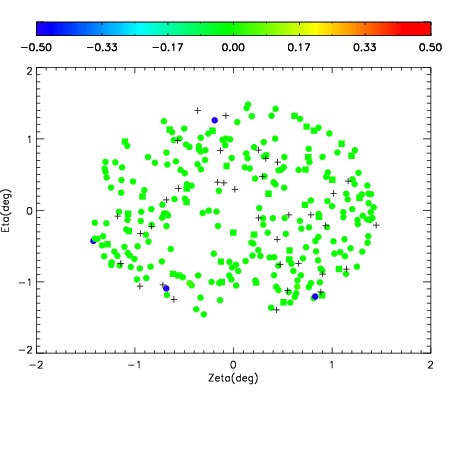
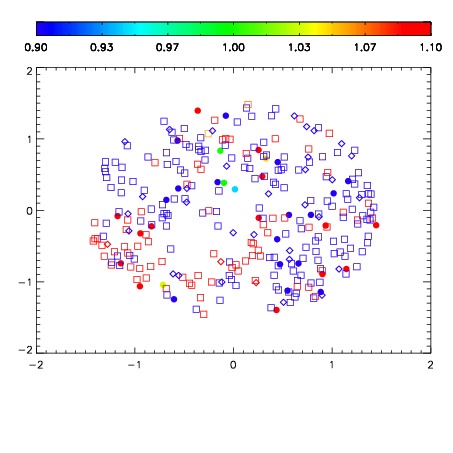
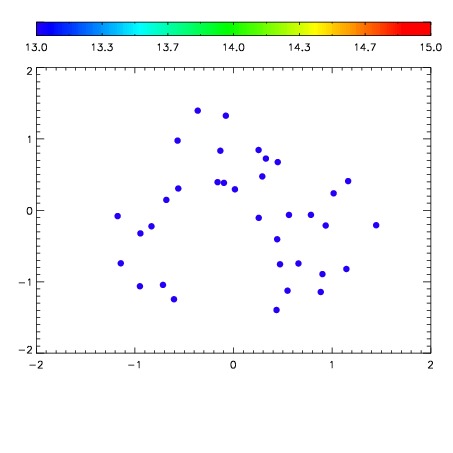

| Frame | Nreads | Zeropoints | Mag plots | Spatial mag deviation | Spatial sky 16325A emission deviations (filled: sky, open: star) | Spatial sky continuum emission | Spatial sky telluric CO2 absorption deviations (filled: H < 10) | |||||||||||||||||||||||
| 0 | 0 |
|
|
|
|
|
|
| IPAIR | NAME | SHIFT | NEWSHIFT | S/N | NAME | SHIFT | NEWSHIFT | S/N |
| 0 | 11710082 | 0.487187 | 0.00000 | 18.9707 | 11710088 | -0.00284565 | 0.490033 | 18.9412 |
| 1 | 11710086 | 0.485105 | 0.00208199 | 19.0030 | 11710084 | -0.000576729 | 0.487764 | 18.9711 |
| 2 | 11710087 | 0.485826 | 0.00136101 | 18.9934 | 11710085 | -0.000625788 | 0.487813 | 18.9567 |
| 3 | 11710083 | 0.486574 | 0.000613004 | 18.9503 | 11710081 | 0.00000 | 0.487187 | 18.9362 |