| Red | Green | Blue | |
| z | 17.64 | ||
| znorm | Inf | ||
| sky | -Inf | -Inf | -NaN |
| S/N | 28.1 | 45.3 | 49.1 |
| S/N(c) | 0.0 | 0.0 | 0.0 |
| SN(E/C) |
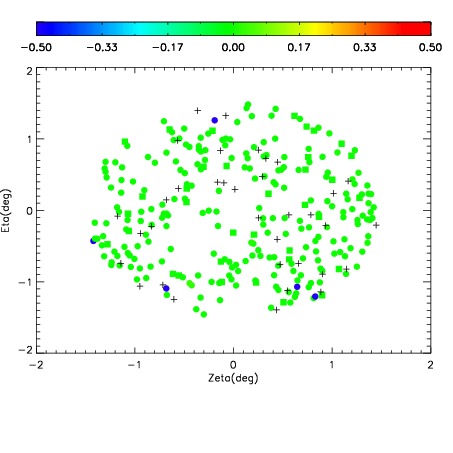
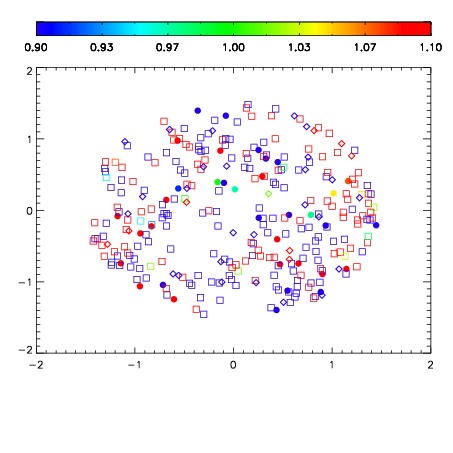
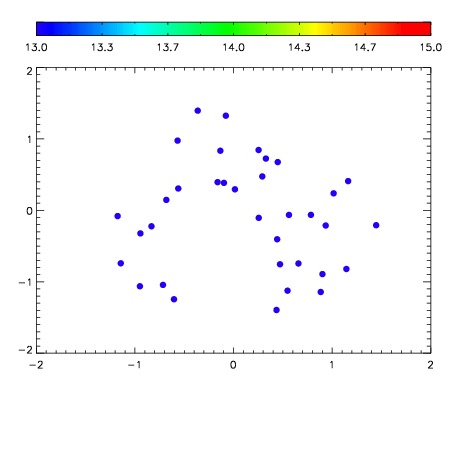

| Frame | Nreads | Zeropoints | Mag plots | Spatial mag deviation | Spatial sky 16325A emission deviations (filled: sky, open: star) | Spatial sky continuum emission | Spatial sky telluric CO2 absorption deviations (filled: H < 10) | |||||||||||||||||||||||
| 0 | 0 |
|
|
|
|
|
|
| IPAIR | NAME | SHIFT | NEWSHIFT | S/N | NAME | SHIFT | NEWSHIFT | S/N |
| 0 | 12180013 | 0.492711 | 0.00000 | 19.0729 | 12180011 | 0.00000 | 0.492711 | 19.0663 |
| 1 | 12180017 | 0.491627 | 0.00108400 | 19.0979 | 12180014 | -0.00358183 | 0.496293 | 19.1039 |
| 2 | 12180012 | 0.492031 | 0.000680000 | 19.0865 | 12180018 | 0.000950110 | 0.491761 | 19.0889 |
| 3 | 12180016 | 0.491623 | 0.00108799 | 19.0789 | 12180015 | -0.00340264 | 0.496114 | 19.0830 |