| Red | Green | Blue | |
| z | 17.64 | ||
| znorm | Inf | ||
| sky | -Inf | -Inf | -Inf |
| S/N | 24.9 | 43.0 | 43.9 |
| S/N(c) | 0.0 | 0.0 | 0.0 |
| SN(E/C) |
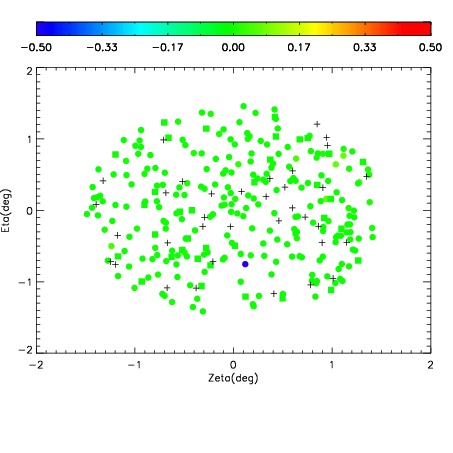
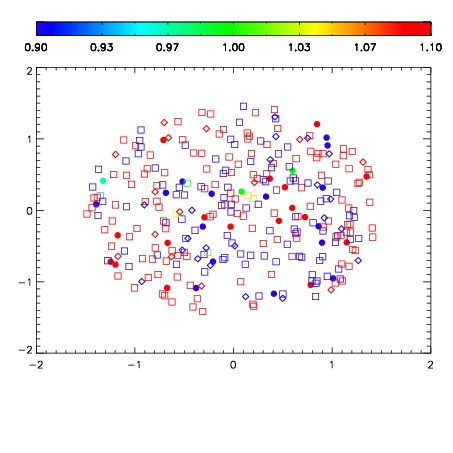
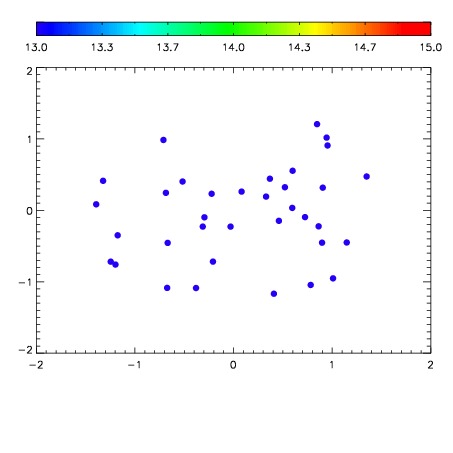

| Frame | Nreads | Zeropoints | Mag plots | Spatial mag deviation | Spatial sky 16325A emission deviations (filled: sky, open: star) | Spatial sky continuum emission | Spatial sky telluric CO2 absorption deviations (filled: H < 10) | |||||||||||||||||||||||
| 0 | 0 |
|
|
|
|
|
|
| IPAIR | NAME | SHIFT | NEWSHIFT | S/N | NAME | SHIFT | NEWSHIFT | S/N |
| 0 | 11440070 | 0.479326 | 0.00000 | 18.9655 | 11440071 | -0.00201104 | 0.481337 | 18.9276 |
| 1 | 11440073 | 0.472551 | 0.00677502 | 18.9762 | 11440075 | -0.00434360 | 0.483670 | 18.9697 |
| 2 | 11440069 | 0.478562 | 0.000764012 | 18.9682 | 11440068 | 0.00000 | 0.479326 | 18.9401 |
| 3 | 11440074 | 0.473240 | 0.00608602 | 18.9386 | 11440072 | -0.00219815 | 0.481524 | 18.9060 |