| Red | Green | Blue | |
| z | 17.64 | ||
| znorm | Inf | ||
| sky | -NaN | -NaN | -Inf |
| S/N | 26.0 | 45.2 | 48.9 |
| S/N(c) | 0.0 | 0.0 | 0.0 |
| SN(E/C) |
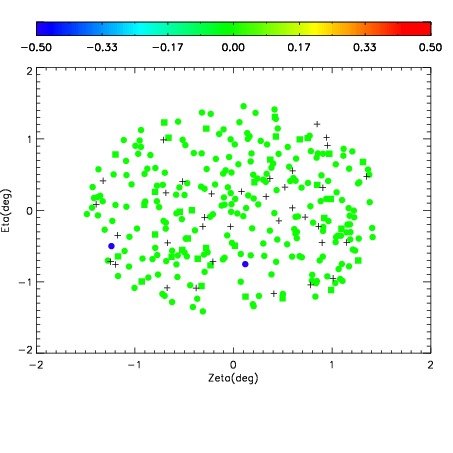
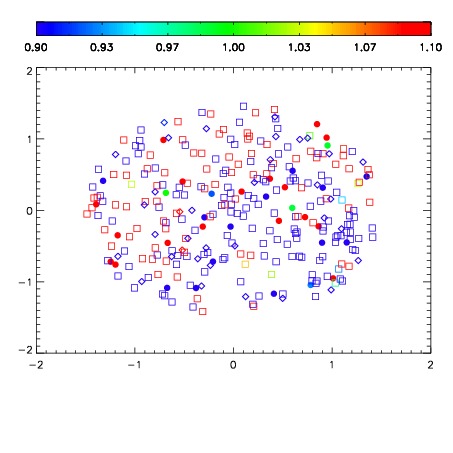
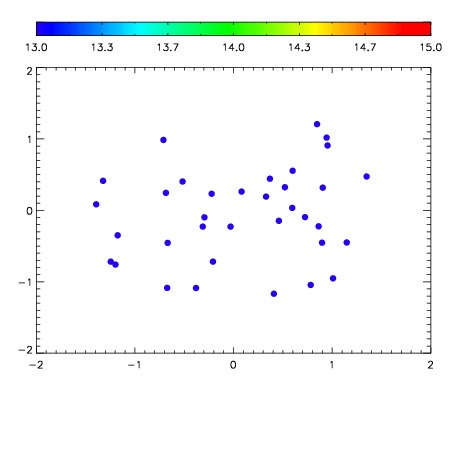

| Frame | Nreads | Zeropoints | Mag plots | Spatial mag deviation | Spatial sky 16325A emission deviations (filled: sky, open: star) | Spatial sky continuum emission | Spatial sky telluric CO2 absorption deviations (filled: H < 10) | |||||||||||||||||||||||
| 0 | 0 |
|
|
|
|
|
|
| IPAIR | NAME | SHIFT | NEWSHIFT | S/N | NAME | SHIFT | NEWSHIFT | S/N |
| 0 | 11710072 | 0.485957 | 0.00000 | 19.0037 | 11710077 | -0.00382941 | 0.489786 | 19.0422 |
| 1 | 11710071 | 0.485469 | 0.000487983 | 19.0268 | 11710073 | -0.00281586 | 0.488773 | 19.0652 |
| 2 | 11710075 | 0.484289 | 0.00166801 | 18.9792 | 11710074 | -0.00346687 | 0.489424 | 19.0345 |
| 3 | 11710076 | 0.485366 | 0.000591010 | 18.9546 | 11710070 | 0.00000 | 0.485957 | 18.9062 |