| Red | Green | Blue | |
| z | 17.64 | ||
| znorm | Inf | ||
| sky | -NaN | -NaN | -Inf |
| S/N | 25.0 | 44.3 | 46.7 |
| S/N(c) | 0.0 | 0.0 | 0.0 |
| SN(E/C) |
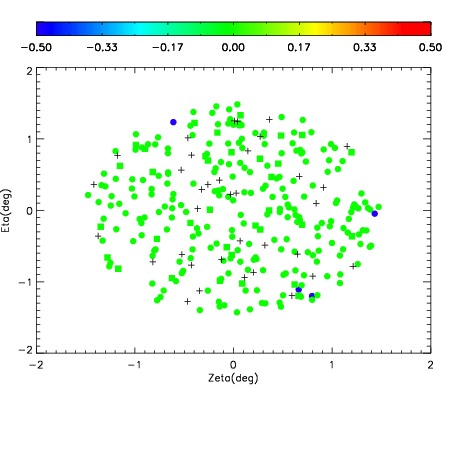
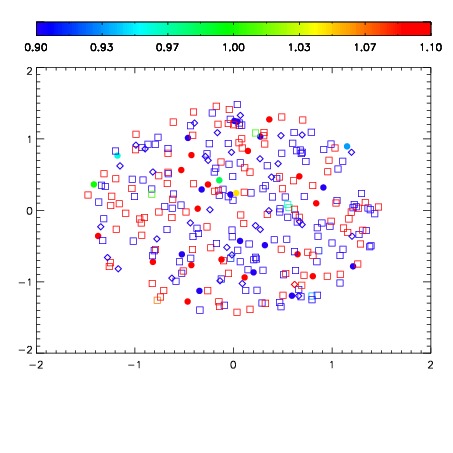
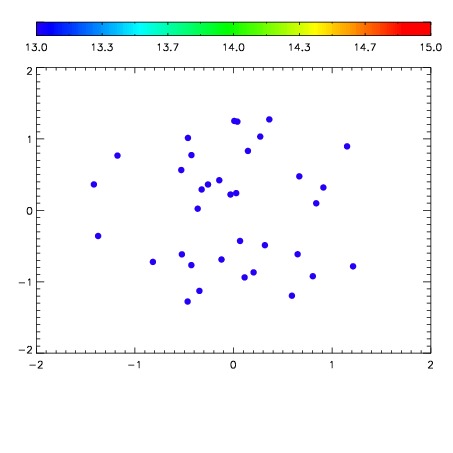

| Frame | Nreads | Zeropoints | Mag plots | Spatial mag deviation | Spatial sky 16325A emission deviations (filled: sky, open: star) | Spatial sky continuum emission | Spatial sky telluric CO2 absorption deviations (filled: H < 10) | |||||||||||||||||||||||
| 0 | 0 |
|
|
|
|
|
|
| IPAIR | NAME | SHIFT | NEWSHIFT | S/N | NAME | SHIFT | NEWSHIFT | S/N |
| 0 | 08970017 | 0.482847 | 0.00000 | 18.8970 | 08970018 | -3.52300e-05 | 0.482882 | 18.8220 |
| 1 | 08970016 | 0.481813 | 0.00103399 | 18.9699 | 08970015 | 0.00106176 | 0.481785 | 19.0139 |
| 2 | 08970012 | 0.479115 | 0.00373200 | 18.9401 | 08970014 | 0.000804695 | 0.482042 | 18.9725 |
| 3 | 08970013 | 0.478164 | 0.00468302 | 18.9272 | 08970011 | 0.00000 | 0.482847 | 18.8507 |