| Red | Green | Blue | |
| z | 17.64 | ||
| znorm | Inf | ||
| sky | -Inf | -Inf | -Inf |
| S/N | 24.8 | 43.0 | 46.2 |
| S/N(c) | 0.0 | 0.0 | 0.0 |
| SN(E/C) |

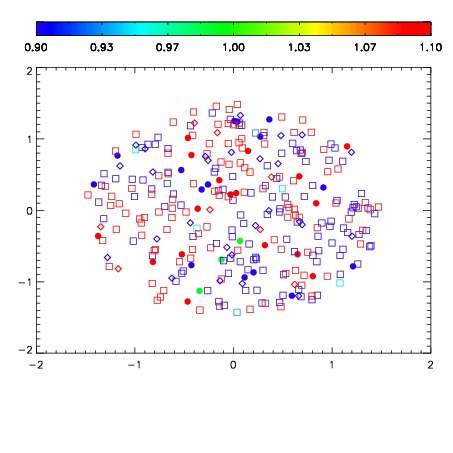


| Frame | Nreads | Zeropoints | Mag plots | Spatial mag deviation | Spatial sky 16325A emission deviations (filled: sky, open: star) | Spatial sky continuum emission | Spatial sky telluric CO2 absorption deviations (filled: H < 10) | |||||||||||||||||||||||
| 0 | 0 |
|
|
|
|
|
|
| IPAIR | NAME | SHIFT | NEWSHIFT | S/N | NAME | SHIFT | NEWSHIFT | S/N |
| 0 | 11360098 | 0.482474 | 0.00000 | 18.9222 | 11360100 | 0.00134121 | 0.481133 | 18.8380 |
| 1 | 11360097 | 0.480913 | 0.00156099 | 19.0065 | 11360103 | 0.000768958 | 0.481705 | 19.0706 |
| 2 | 11360102 | 0.482321 | 0.000153005 | 18.9902 | 11360096 | 0.00000 | 0.482474 | 19.0158 |
| 3 | 11360101 | 0.481858 | 0.000616014 | 18.8783 | 11360099 | 0.00124701 | 0.481227 | 18.8336 |