| Red | Green | Blue | |
| z | 17.64 | ||
| znorm | Inf | ||
| sky | -NaN | -Inf | -Inf |
| S/N | 25.4 | 44.2 | 47.7 |
| S/N(c) | 0.0 | 0.0 | 0.0 |
| SN(E/C) |
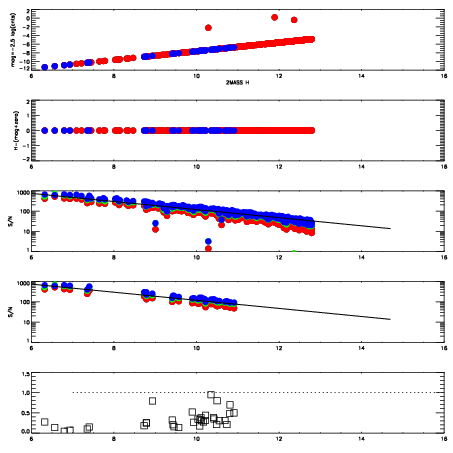
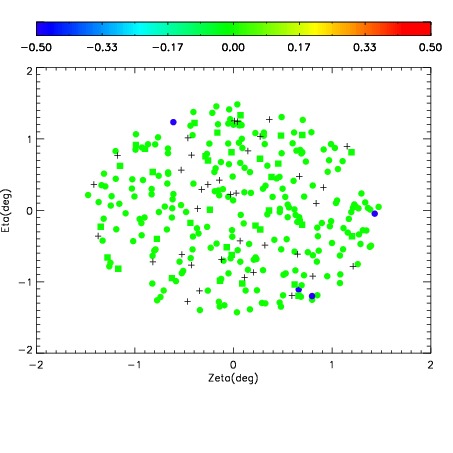
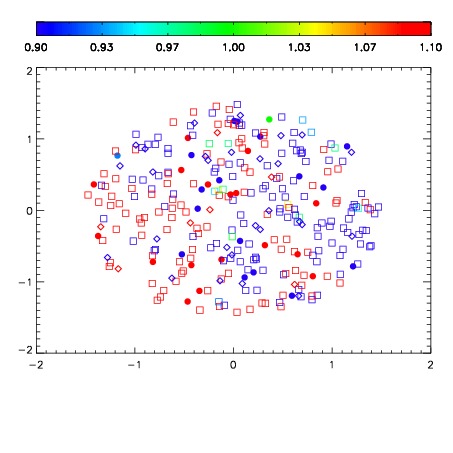


| Frame | Nreads | Zeropoints | Mag plots | Spatial mag deviation | Spatial sky 16325A emission deviations (filled: sky, open: star) | Spatial sky continuum emission | Spatial sky telluric CO2 absorption deviations (filled: H < 10) | |||||||||||||||||||||||
| 0 | 0 |
|
|
|
|
|
|
| IPAIR | NAME | SHIFT | NEWSHIFT | S/N | NAME | SHIFT | NEWSHIFT | S/N |
| 0 | 11380094 | 0.472971 | 0.00000 | 18.9117 | 11380092 | 0.00000 | 0.472971 | 18.9361 |
| 1 | 11380097 | 0.472451 | 0.000519991 | 18.9610 | 11380095 | -2.63590e-05 | 0.472997 | 18.9573 |
| 2 | 11380098 | 0.472948 | 2.29776e-05 | 18.8783 | 11380096 | -0.000228924 | 0.473200 | 18.9218 |
| 3 | 11380093 | 0.472891 | 7.99894e-05 | 18.8760 | 11380099 | -0.000125079 | 0.473096 | 18.8950 |