| Red | Green | Blue | |
| z | 17.64 | ||
| znorm | Inf | ||
| sky | -Inf | -Inf | -Inf |
| S/N | 24.9 | 43.9 | 47.3 |
| S/N(c) | 0.0 | 0.0 | 0.0 |
| SN(E/C) |
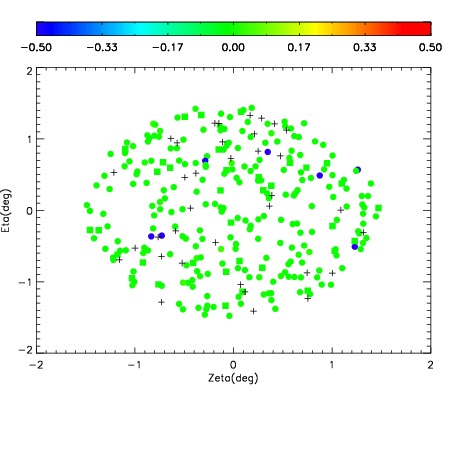
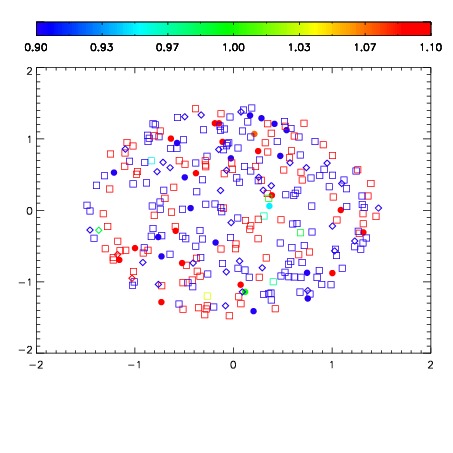


| Frame | Nreads | Zeropoints | Mag plots | Spatial mag deviation | Spatial sky 16325A emission deviations (filled: sky, open: star) | Spatial sky continuum emission | Spatial sky telluric CO2 absorption deviations (filled: H < 10) | |||||||||||||||||||||||
| 0 | 0 |
|
|
|
|
|
|
| IPAIR | NAME | SHIFT | NEWSHIFT | S/N | NAME | SHIFT | NEWSHIFT | S/N |
| 0 | 08760013 | 0.481881 | 0.00000 | 18.9136 | 08760014 | -0.000574305 | 0.482455 | 18.8897 |
| 1 | 08760016 | 0.479952 | 0.00192899 | 19.0016 | 08760018 | -0.000371806 | 0.482253 | 18.9775 |
| 2 | 08760017 | 0.480928 | 0.000952989 | 19.0005 | 08760015 | -0.000836580 | 0.482718 | 18.9246 |
| 3 | 08760012 | 0.480848 | 0.00103298 | 18.9180 | 08760011 | 0.00000 | 0.481881 | 18.9122 |