| Red | Green | Blue | |
| z | 17.64 | ||
| znorm | Inf | ||
| sky | -Inf | -Inf | -Inf |
| S/N | 34.3 | 61.9 | 65.5 |
| S/N(c) | 0.0 | 0.0 | 0.0 |
| SN(E/C) |
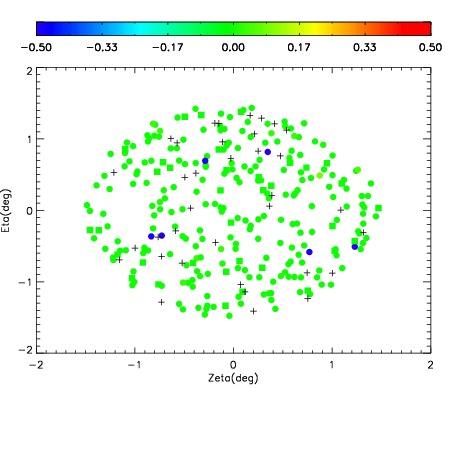
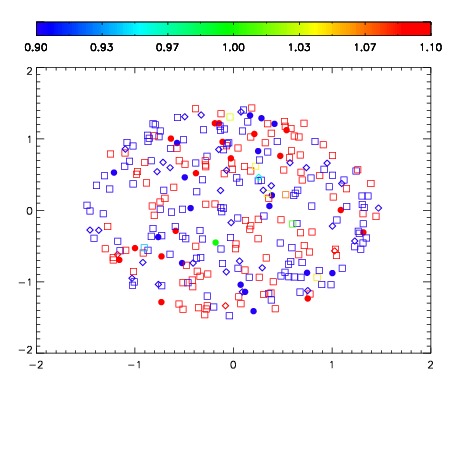
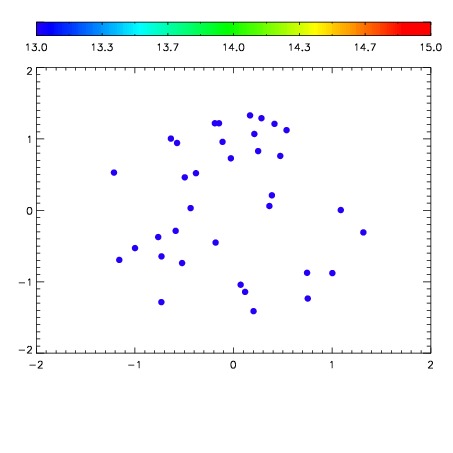

| Frame | Nreads | Zeropoints | Mag plots | Spatial mag deviation | Spatial sky 16325A emission deviations (filled: sky, open: star) | Spatial sky continuum emission | Spatial sky telluric CO2 absorption deviations (filled: H < 10) | |||||||||||||||||||||||
| 0 | 0 |
|
|
|
|
|
|
| IPAIR | NAME | SHIFT | NEWSHIFT | S/N | NAME | SHIFT | NEWSHIFT | S/N |
| 0 | 11120110 | 0.481334 | 0.00000 | 18.9858 | 11120103 | 4.59615e-05 | 0.481288 | 18.9884 |
| 1 | 11120101 | 0.478557 | 0.00277701 | 19.0546 | 11120100 | -0.00129054 | 0.482625 | 19.0862 |
| 2 | 11120109 | 0.480332 | 0.00100201 | 19.0477 | 11120099 | -0.00150506 | 0.482839 | 19.0625 |
| 3 | 11120098 | 0.479471 | 0.00186300 | 19.0444 | 11120111 | 0.00142756 | 0.479906 | 19.0427 |
| 4 | 11120102 | 0.479142 | 0.00219199 | 19.0077 | 11120096 | 0.00000 | 0.481334 | 19.0426 |
| 5 | 11120105 | 0.478364 | 0.00297001 | 18.9552 | 11120104 | -0.000178307 | 0.481512 | 18.9493 |
| 6 | 11120106 | 0.478610 | 0.00272399 | 18.9548 | 11120108 | -0.000957430 | 0.482291 | 18.9302 |
| 7 | 11120097 | 0.478437 | 0.00289699 | 18.9405 | 11120107 | -0.000974399 | 0.482308 | 18.9224 |