| Red | Green | Blue | |
| z | 17.64 | ||
| znorm | Inf | ||
| sky | -Inf | -Inf | -Inf |
| S/N | 21.5 | 38.1 | 39.8 |
| S/N(c) | 0.0 | 0.0 | 0.0 |
| SN(E/C) |
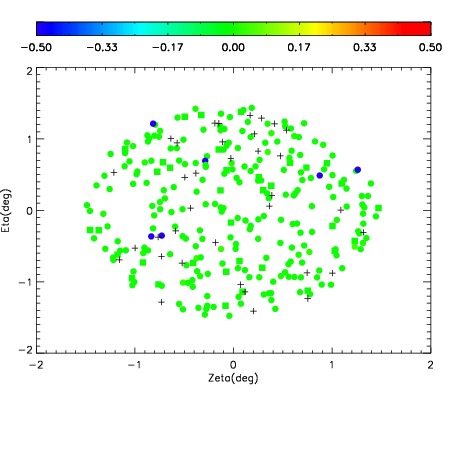
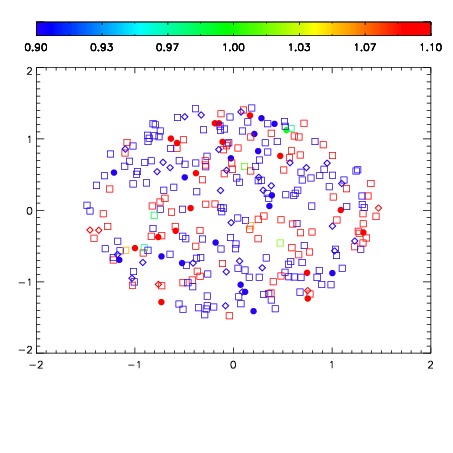
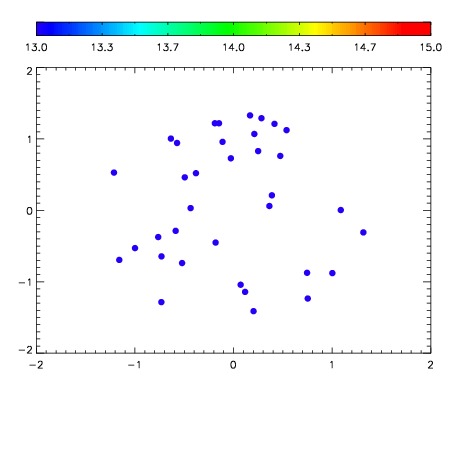

| Frame | Nreads | Zeropoints | Mag plots | Spatial mag deviation | Spatial sky 16325A emission deviations (filled: sky, open: star) | Spatial sky continuum emission | Spatial sky telluric CO2 absorption deviations (filled: H < 10) | |||||||||||||||||||||||
| 0 | 0 |
|
|
|
|
|
|
| IPAIR | NAME | SHIFT | NEWSHIFT | S/N | NAME | SHIFT | NEWSHIFT | S/N |
| 0 | 11160067 | 0.482763 | 0.00000 | 18.6925 | 11160061 | 0.00000 | 0.482763 | 18.7162 |
| 1 | 11160062 | 0.478543 | 0.00421998 | 18.8644 | 11160068 | -0.00229610 | 0.485059 | 18.8015 |
| 2 | 11160063 | 0.479961 | 0.00280198 | 18.8045 | 11160064 | -0.00375998 | 0.486523 | 18.7829 |
| 3 | 11160066 | 0.481611 | 0.00115198 | 18.6804 | 11160065 | -0.00333219 | 0.486095 | 18.7146 |