| Red | Green | Blue | |
| z | 17.64 | ||
| znorm | Inf | ||
| sky | -Inf | -Inf | -Inf |
| S/N | 25.7 | 44.8 | 48.0 |
| S/N(c) | 0.0 | 0.0 | 0.0 |
| SN(E/C) |
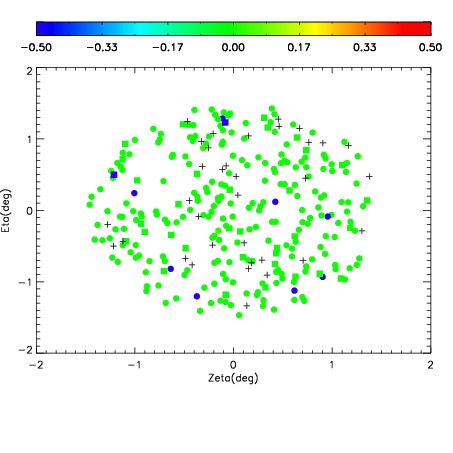
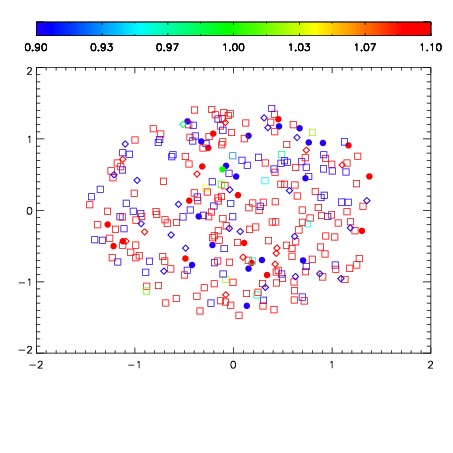
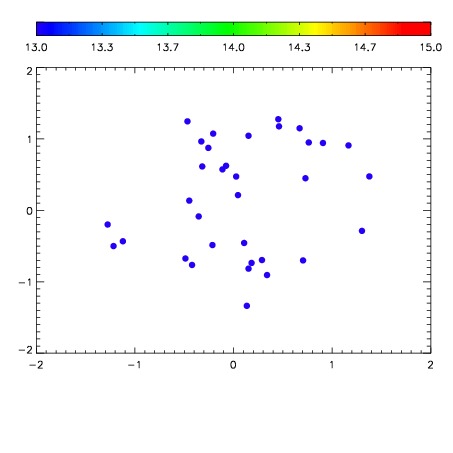

| Frame | Nreads | Zeropoints | Mag plots | Spatial mag deviation | Spatial sky 16325A emission deviations (filled: sky, open: star) | Spatial sky continuum emission | Spatial sky telluric CO2 absorption deviations (filled: H < 10) | |||||||||||||||||||||||
| 0 | 0 |
|
|
|
|
|
|
| IPAIR | NAME | SHIFT | NEWSHIFT | S/N | NAME | SHIFT | NEWSHIFT | S/N |
| 0 | 04890020 | 0.495848 | 0.00000 | 18.9313 | 04890014 | 0.00000 | 0.495848 | 18.9560 |
| 1 | 04890015 | 0.494046 | 0.00180200 | 19.0080 | 04890021 | 0.00474788 | 0.491100 | 19.0075 |
| 2 | 04890019 | 0.494297 | 0.00155100 | 18.9013 | 04890018 | 0.00412103 | 0.491727 | 18.8892 |
| 3 | 04890016 | 0.495005 | 0.000842988 | 18.8543 | 04890017 | 0.00180817 | 0.494040 | 18.8226 |