| Red | Green | Blue | |
| z | 17.63 | ||
| znorm | Inf | ||
| sky | -NaN | -NaN | -Inf |
| S/N | 26.9 | 46.1 | 49.9 |
| S/N(c) | 0.0 | 0.0 | 0.0 |
| SN(E/C) |
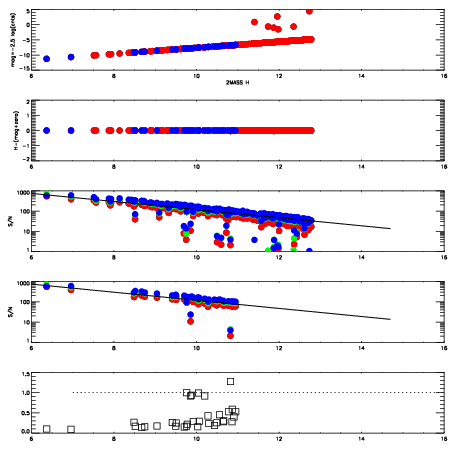


| Frame | Nreads | Zeropoints | Mag plots | Spatial mag deviation | Spatial sky 16325A emission deviations (filled: sky, open: star) | Spatial sky continuum emission | Spatial sky telluric CO2 absorption deviations (filled: H < 10) | |||||||||||||||||||||||
| 0 | 0 |
|
|
|
|
|
|
| IPAIR | NAME | SHIFT | NEWSHIFT | S/N | NAME | SHIFT | NEWSHIFT | S/N |
| 0 | 08430017 | 0.485413 | 0.00000 | 19.0767 | 08430018 | -0.00231935 | 0.487732 | 19.1099 |
| 1 | 08430012 | 0.483980 | 0.00143301 | 19.0224 | 08430014 | 0.00289983 | 0.482513 | 19.0458 |
| 2 | 08430016 | 0.485384 | 2.90275e-05 | 19.0204 | 08430015 | -0.00140347 | 0.486816 | 19.0064 |
| 3 | 08430013 | 0.484035 | 0.00137803 | 19.0119 | 08430011 | 0.00000 | 0.485413 | 18.9763 |