| Red | Green | Blue | |
| z | 17.64 | ||
| znorm | Inf | ||
| sky | -Inf | -Inf | -Inf |
| S/N | 27.0 | 47.4 | 49.9 |
| S/N(c) | 0.0 | 0.0 | 0.0 |
| SN(E/C) |
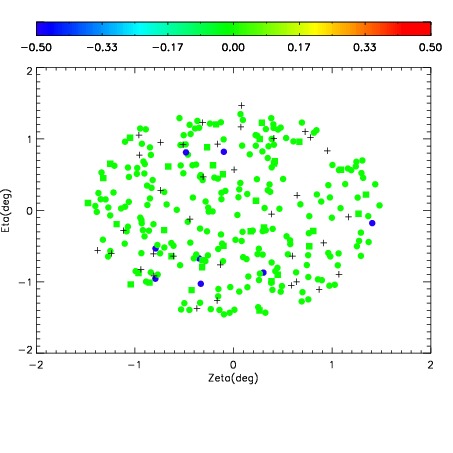


| Frame | Nreads | Zeropoints | Mag plots | Spatial mag deviation | Spatial sky 16325A emission deviations (filled: sky, open: star) | Spatial sky continuum emission | Spatial sky telluric CO2 absorption deviations (filled: H < 10) | |||||||||||||||||||||||
| 0 | 0 |
|
|
|
|
|
|
| IPAIR | NAME | SHIFT | NEWSHIFT | S/N | NAME | SHIFT | NEWSHIFT | S/N |
| 0 | 04870017 | 0.498575 | 0.00000 | 19.0366 | 04870015 | -0.000238215 | 0.498813 | 19.0205 |
| 1 | 04870013 | 0.497310 | 0.00126499 | 19.0792 | 04870014 | 0.00158213 | 0.496993 | 19.0659 |
| 2 | 04870012 | 0.498267 | 0.000308007 | 19.0752 | 04870018 | 0.00271979 | 0.495855 | 19.0601 |
| 3 | 04870016 | 0.497264 | 0.00131100 | 19.0651 | 04870011 | 0.00000 | 0.498575 | 19.0551 |