| Red | Green | Blue | |
| z | 17.64 | ||
| znorm | Inf | ||
| sky | -Inf | -Inf | -Inf |
| S/N | 18.7 | 34.1 | 36.5 |
| S/N(c) | 0.0 | 0.0 | 0.0 |
| SN(E/C) |


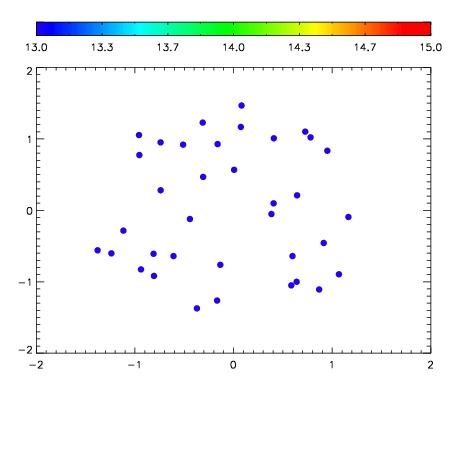

| Frame | Nreads | Zeropoints | Mag plots | Spatial mag deviation | Spatial sky 16325A emission deviations (filled: sky, open: star) | Spatial sky continuum emission | Spatial sky telluric CO2 absorption deviations (filled: H < 10) | |||||||||||||||||||||||
| 0 | 0 |
|
|
|
|
|
|
| IPAIR | NAME | SHIFT | NEWSHIFT | S/N | NAME | SHIFT | NEWSHIFT | S/N |
| 0 | 04910012 | 0.485163 | 0.00000 | 17.9892 | 04910013 | 0.000555809 | 0.484607 | 17.9870 |
| 1 | 04910015 | 0.483177 | 0.00198600 | 18.9037 | 04910017 | 0.000243023 | 0.484920 | 18.8957 |
| 2 | 04910016 | 0.484049 | 0.00111401 | 18.8392 | 04910010 | 0.00000 | 0.485163 | 18.8089 |
| 3 | 04910011 | 0.484200 | 0.000963002 | 18.0501 | 04910014 | -0.000746765 | 0.485910 | 18.2904 |