| Red | Green | Blue | |
| z | 17.64 | ||
| znorm | Inf | ||
| sky | -NaN | -Inf | -Inf |
| S/N | 24.6 | 43.3 | 46.4 |
| S/N(c) | 0.0 | 0.0 | 0.0 |
| SN(E/C) |
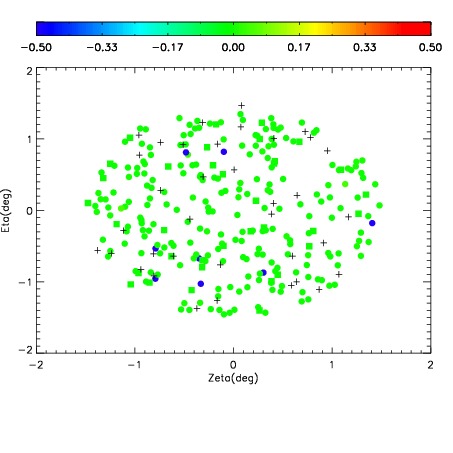
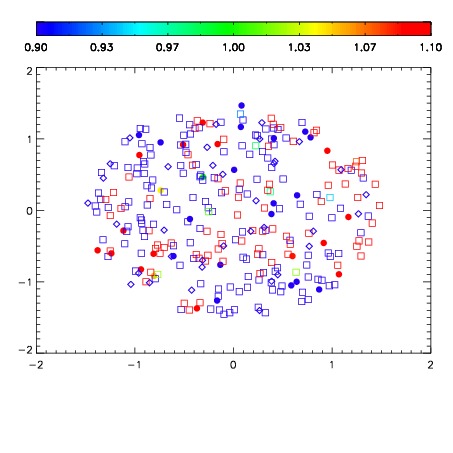
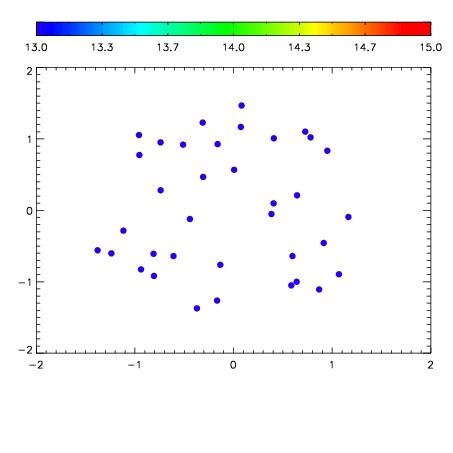

| Frame | Nreads | Zeropoints | Mag plots | Spatial mag deviation | Spatial sky 16325A emission deviations (filled: sky, open: star) | Spatial sky continuum emission | Spatial sky telluric CO2 absorption deviations (filled: H < 10) | |||||||||||||||||||||||
| 0 | 0 |
|
|
|
|
|
|
| IPAIR | NAME | SHIFT | NEWSHIFT | S/N | NAME | SHIFT | NEWSHIFT | S/N |
| 0 | 08430027 | 0.485301 | 0.00000 | 19.0417 | 08430029 | 0.00166164 | 0.483639 | 19.0241 |
| 1 | 08430028 | 0.485231 | 6.99759e-05 | 19.0824 | 08430026 | 0.00000 | 0.485301 | 19.0800 |
| 2 | 08430031 | 0.483560 | 0.00174099 | 18.9471 | 08430033 | 0.00149695 | 0.483804 | 19.0175 |
| 3 | 08430032 | 0.483922 | 0.00137898 | 18.9306 | 08430030 | 0.00231374 | 0.482987 | 19.0004 |