| Red | Green | Blue | |
| z | 17.64 | ||
| znorm | Inf | ||
| sky | -Inf | -Inf | -Inf |
| S/N | 27.6 | 46.0 | 49.7 |
| S/N(c) | 0.0 | 0.0 | 0.0 |
| SN(E/C) |
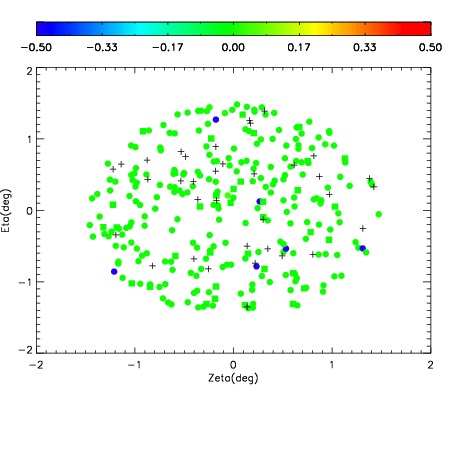


| Frame | Nreads | Zeropoints | Mag plots | Spatial mag deviation | Spatial sky 16325A emission deviations (filled: sky, open: star) | Spatial sky continuum emission | Spatial sky telluric CO2 absorption deviations (filled: H < 10) | |||||||||||||||||||||||
| 0 | 0 |
|
|
|
|
|
|
| IPAIR | NAME | SHIFT | NEWSHIFT | S/N | NAME | SHIFT | NEWSHIFT | S/N |
| 0 | 08420013 | 0.501274 | 0.00000 | 19.1026 | 08420018 | -0.0779589 | 0.579233 | 19.0858 |
| 1 | 08420012 | 0.500201 | 0.00107300 | 19.0800 | 08420015 | 0.000296688 | 0.500977 | 19.0836 |
| 2 | 08420016 | 0.412974 | 0.0883000 | 19.0739 | 08420014 | -0.000185863 | 0.501460 | 19.0726 |
| 3 | 08420017 | 0.413542 | 0.0877320 | 19.0626 | 08420011 | 0.00000 | 0.501274 | 19.0513 |