| Red | Green | Blue | |
| z | 17.64 | ||
| znorm | Inf | ||
| sky | -Inf | -Inf | -Inf |
| S/N | 23.3 | 39.3 | 42.7 |
| S/N(c) | 0.0 | 0.0 | 0.0 |
| SN(E/C) |
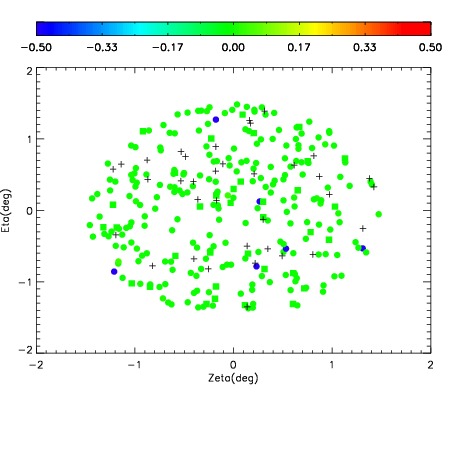
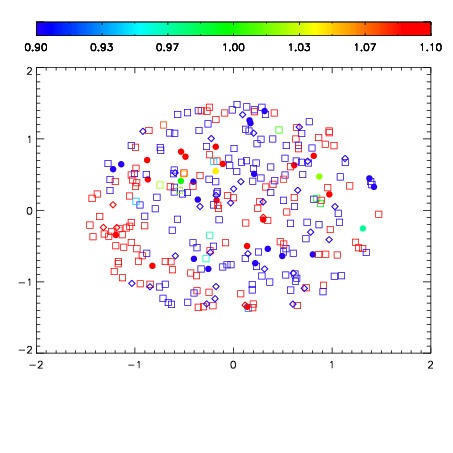
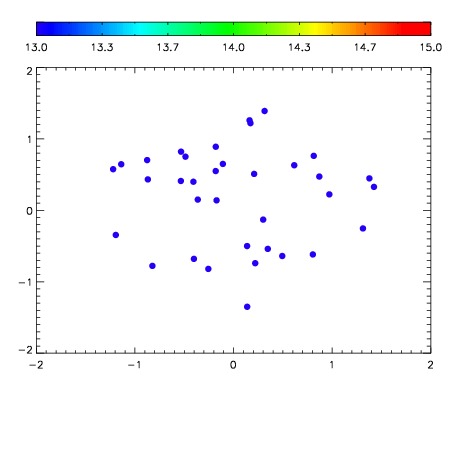

| Frame | Nreads | Zeropoints | Mag plots | Spatial mag deviation | Spatial sky 16325A emission deviations (filled: sky, open: star) | Spatial sky continuum emission | Spatial sky telluric CO2 absorption deviations (filled: H < 10) | |||||||||||||||||||||||
| 0 | 0 |
|
|
|
|
|
|
| IPAIR | NAME | SHIFT | NEWSHIFT | S/N | NAME | SHIFT | NEWSHIFT | S/N |
| 0 | 08480013 | 0.487508 | 0.00000 | 18.7176 | 08480014 | -0.883384 | 1.37089 | 18.0396 |
| 1 | 08480016 | 0.00449257 | 0.483015 | 18.9875 | 08480015 | -0.485243 | 0.972751 | 19.0688 |
| 2 | 08480017 | 0.00467747 | 0.482831 | 18.9666 | 08480018 | -0.483471 | 0.970979 | 18.9707 |
| 3 | 08480012 | 0.486816 | 0.000692010 | 18.7515 | 08480011 | 0.00000 | 0.487508 | 18.4856 |