| Red | Green | Blue | |
| z | 17.64 | ||
| znorm | Inf | ||
| sky | -Inf | -Inf | -Inf |
| S/N | 20.6 | 36.1 | 38.6 |
| S/N(c) | 0.0 | 0.0 | 0.0 |
| SN(E/C) |
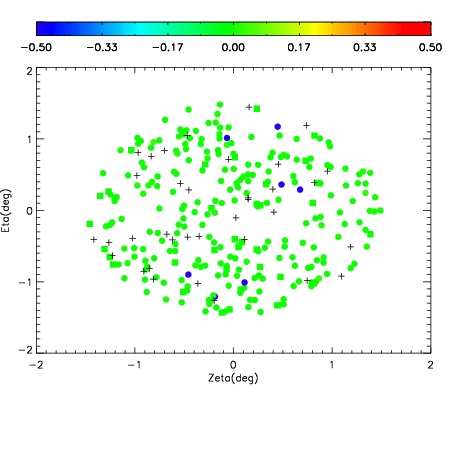
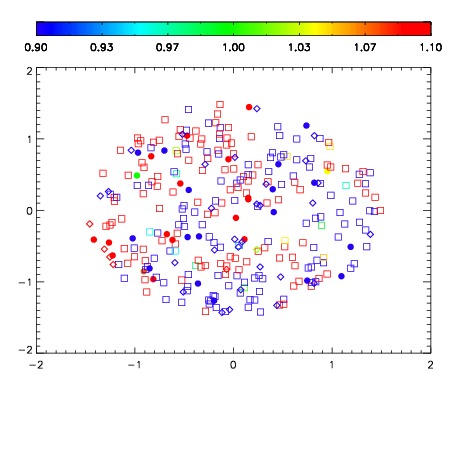
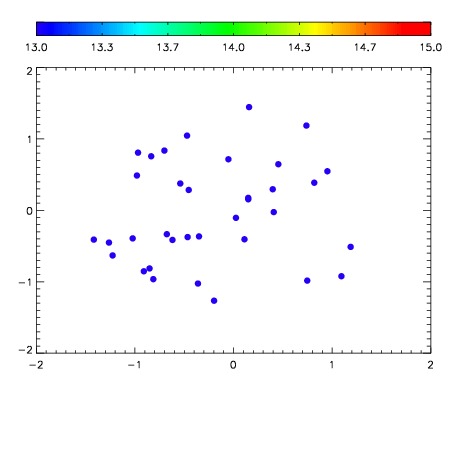

| Frame | Nreads | Zeropoints | Mag plots | Spatial mag deviation | Spatial sky 16325A emission deviations (filled: sky, open: star) | Spatial sky continuum emission | Spatial sky telluric CO2 absorption deviations (filled: H < 10) | |||||||||||||||||||||||
| 0 | 0 |
|
|
|
|
|
|
| IPAIR | NAME | SHIFT | NEWSHIFT | S/N | NAME | SHIFT | NEWSHIFT | S/N |
| 0 | 04050064 | 0.495335 | 0.00000 | 18.4400 | 04050058 | 0.00000 | 0.495335 | 18.2323 |
| 1 | 04050059 | 0.493699 | 0.00163600 | 18.8003 | 04050061 | 0.000218071 | 0.495117 | 18.7674 |
| 2 | 04050060 | 0.494649 | 0.000686020 | 18.7422 | 04050062 | -0.000858749 | 0.496194 | 18.6454 |
| 3 | 04050063 | 0.493627 | 0.00170800 | 18.5148 | 04050065 | -0.00105031 | 0.496385 | 18.3861 |