| Red | Green | Blue | |
| z | 17.64 | ||
| znorm | Inf | ||
| sky | -NaN | -NaN | -Inf |
| S/N | 27.8 | 47.9 | 52.6 |
| S/N(c) | 0.0 | 0.0 | 0.0 |
| SN(E/C) |
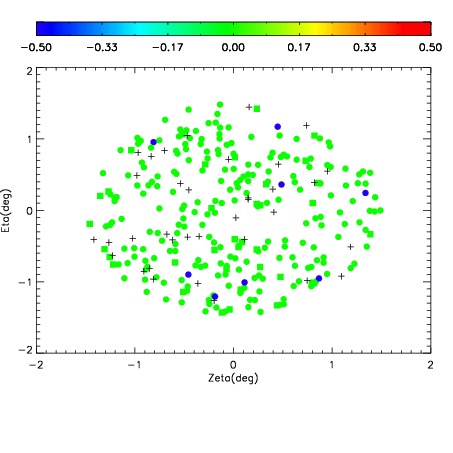
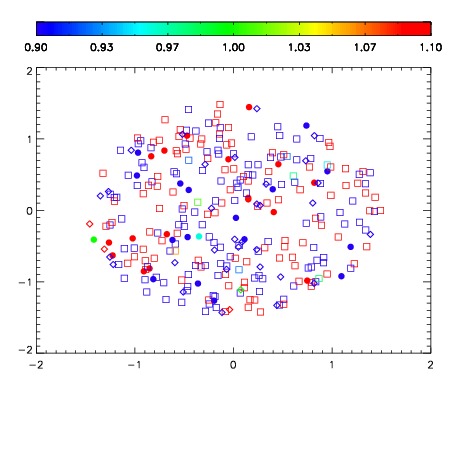
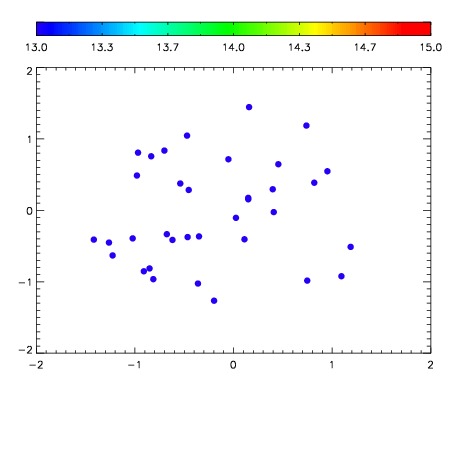

| Frame | Nreads | Zeropoints | Mag plots | Spatial mag deviation | Spatial sky 16325A emission deviations (filled: sky, open: star) | Spatial sky continuum emission | Spatial sky telluric CO2 absorption deviations (filled: H < 10) | |||||||||||||||||||||||
| 0 | 0 |
|
|
|
|
|
|
| IPAIR | NAME | SHIFT | NEWSHIFT | S/N | NAME | SHIFT | NEWSHIFT | S/N |
| 0 | 04280047 | 0.498676 | 0.00000 | 19.0511 | 04280045 | -0.000672460 | 0.499348 | 19.0677 |
| 1 | 04280046 | 0.494122 | 0.00455400 | 19.0681 | 04280044 | -0.000617940 | 0.499294 | 19.0781 |
| 2 | 04280043 | 0.497310 | 0.00136599 | 19.0631 | 04280048 | -0.000367045 | 0.499043 | 19.0766 |
| 3 | 04280042 | 0.493440 | 0.00523600 | 19.0282 | 04280041 | 0.00000 | 0.498676 | 18.9549 |