| Red | Green | Blue | |
| z | 17.64 | ||
| znorm | Inf | ||
| sky | -Inf | -NaN | -Inf |
| S/N | 25.0 | 44.6 | 47.5 |
| S/N(c) | 0.0 | 0.0 | 0.0 |
| SN(E/C) |
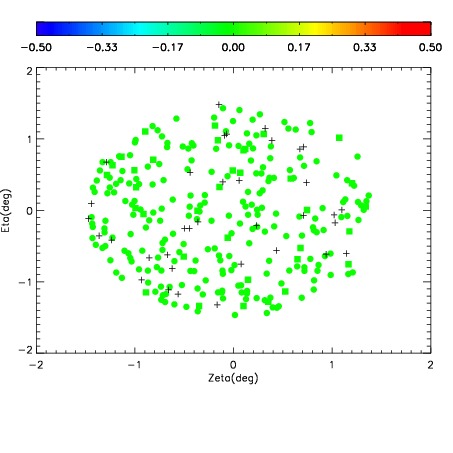
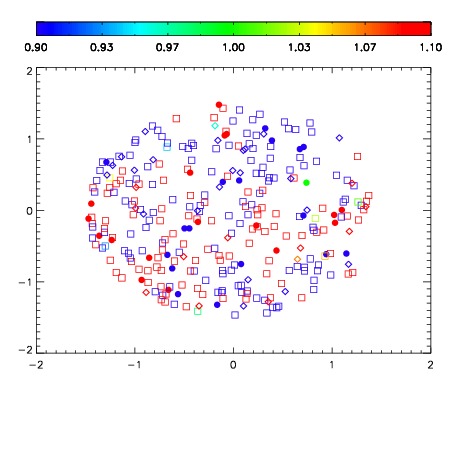
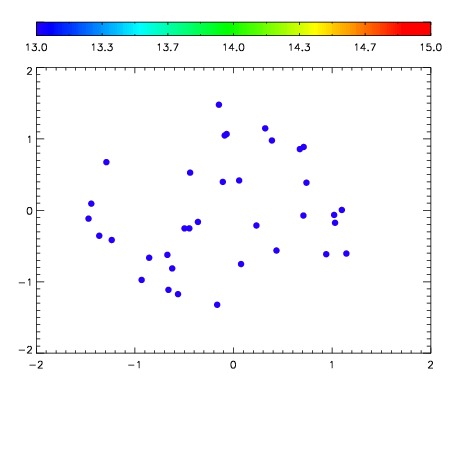

| Frame | Nreads | Zeropoints | Mag plots | Spatial mag deviation | Spatial sky 16325A emission deviations (filled: sky, open: star) | Spatial sky continuum emission | Spatial sky telluric CO2 absorption deviations (filled: H < 10) | |||||||||||||||||||||||
| 0 | 0 |
|
|
|
|
|
|
| IPAIR | NAME | SHIFT | NEWSHIFT | S/N | NAME | SHIFT | NEWSHIFT | S/N |
| 0 | 06990094 | 0.481542 | 0.00000 | 19.1099 | 06990096 | -0.00115834 | 0.482700 | 19.1162 |
| 1 | 06990097 | 0.479002 | 0.00253999 | 19.0973 | 06990095 | -0.00161418 | 0.483156 | 19.0876 |
| 2 | 06990098 | 0.481049 | 0.000492990 | 19.0766 | 06990092 | 0.00000 | 0.481542 | 19.0416 |
| 3 | 06990093 | 0.477722 | 0.00382000 | 19.0574 | 06990099 | -0.00107244 | 0.482614 | 18.7000 |
| 4 | 06990101 | 0.478998 | 0.00254399 | 18.1701 | 06990100 | 0.00102948 | 0.480512 | 18.6661 |