| Red | Green | Blue | |
| z | 17.64 | ||
| znorm | Inf | ||
| sky | -Inf | -Inf | -Inf |
| S/N | 22.6 | 39.8 | 42.9 |
| S/N(c) | 0.0 | 0.0 | 0.0 |
| SN(E/C) |
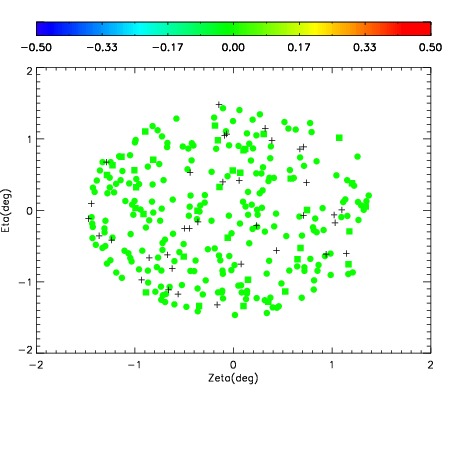
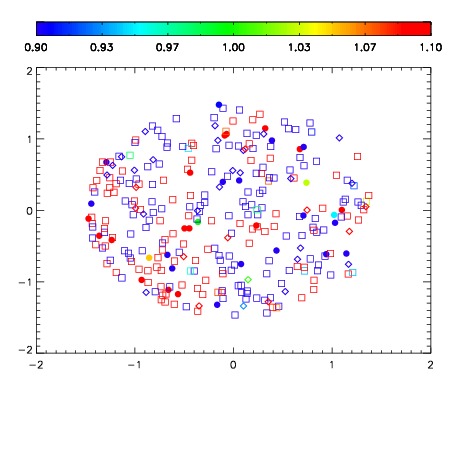
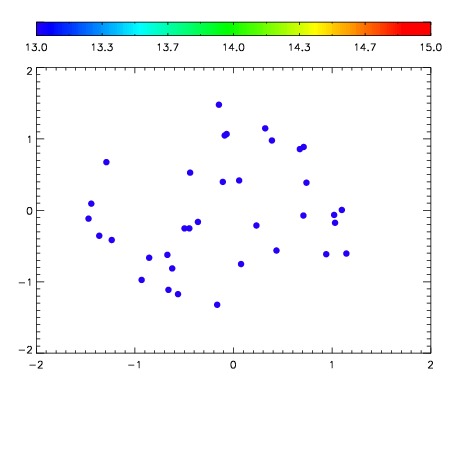

| Frame | Nreads | Zeropoints | Mag plots | Spatial mag deviation | Spatial sky 16325A emission deviations (filled: sky, open: star) | Spatial sky continuum emission | Spatial sky telluric CO2 absorption deviations (filled: H < 10) | |||||||||||||||||||||||
| 0 | 0 |
|
|
|
|
|
|
| IPAIR | NAME | SHIFT | NEWSHIFT | S/N | NAME | SHIFT | NEWSHIFT | S/N |
| 0 | 07050050 | 0.463275 | 0.00000 | 18.8363 | 07050051 | 0.000469165 | 0.462806 | 18.8932 |
| 1 | 07050054 | 0.461992 | 0.00128299 | 19.0027 | 07050055 | -0.00179898 | 0.465074 | 19.0474 |
| 2 | 07050053 | 0.461417 | 0.00185800 | 18.9503 | 07050052 | 0.000587535 | 0.462687 | 18.9651 |
| 3 | 07050049 | 0.462585 | 0.000689983 | 18.8227 | 07050048 | 0.00000 | 0.463275 | 18.8555 |