| Red | Green | Blue | |
| z | 17.64 | ||
| znorm | Inf | ||
| sky | -Inf | -Inf | -Inf |
| S/N | 31.2 | 54.1 | 58.4 |
| S/N(c) | 0.0 | 0.0 | 0.0 |
| SN(E/C) |

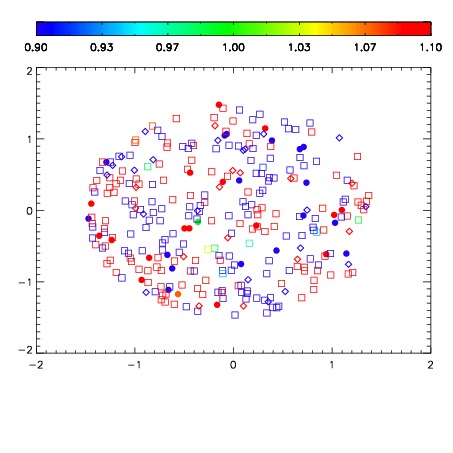


| Frame | Nreads | Zeropoints | Mag plots | Spatial mag deviation | Spatial sky 16325A emission deviations (filled: sky, open: star) | Spatial sky continuum emission | Spatial sky telluric CO2 absorption deviations (filled: H < 10) | |||||||||||||||||||||||
| 0 | 0 |
|
|
|
|
|
|
| IPAIR | NAME | SHIFT | NEWSHIFT | S/N | NAME | SHIFT | NEWSHIFT | S/N |
| 0 | 07540069 | 0.475908 | 0.00000 | 19.1140 | 07540070 | 0.00816796 | 0.467740 | 19.1391 |
| 1 | 07540068 | 0.475242 | 0.000666022 | 19.0848 | 07540067 | 0.00207316 | 0.473835 | 19.1342 |
| 2 | 07540064 | 0.474972 | 0.000936002 | 19.0316 | 07540066 | 0.00479699 | 0.471111 | 19.0826 |
| 3 | 07540065 | 0.475500 | 0.000408024 | 18.9881 | 07540062 | 5.83470e-05 | 0.475850 | 18.9912 |
| 4 | 07540061 | 0.474933 | 0.000975013 | 18.9683 | 07540063 | 0.00263971 | 0.473268 | 18.9905 |
| 5 | 07540060 | 0.474828 | 0.00108001 | 18.8758 | 07540059 | 0.00000 | 0.475908 | 18.8484 |