| Red | Green | Blue | |
| z | 17.63 | ||
| znorm | Inf | ||
| sky | -NaN | -NaN | -Inf |
| S/N | 24.7 | 43.1 | 47.3 |
| S/N(c) | 0.0 | 0.0 | 0.0 |
| SN(E/C) |


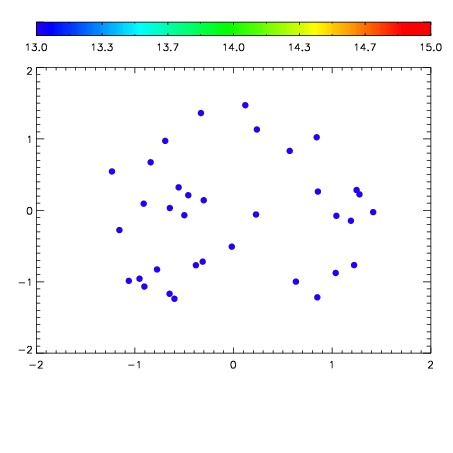

| Frame | Nreads | Zeropoints | Mag plots | Spatial mag deviation | Spatial sky 16325A emission deviations (filled: sky, open: star) | Spatial sky continuum emission | Spatial sky telluric CO2 absorption deviations (filled: H < 10) | |||||||||||||||||||||||
| 0 | 0 |
|
|
|
|
|
|
| IPAIR | NAME | SHIFT | NEWSHIFT | S/N | NAME | SHIFT | NEWSHIFT | S/N |
| 0 | 04920016 | 0.487060 | 0.00000 | 18.5225 | 04920017 | -0.00240788 | 0.489468 | 18.4846 |
| 1 | 04920012 | 0.487005 | 5.50151e-05 | 19.1068 | 04920014 | -0.00331581 | 0.490376 | 19.1346 |
| 2 | 04920011 | 0.485880 | 0.00118002 | 19.1056 | 04920013 | -0.00326769 | 0.490328 | 19.0997 |
| 3 | 04920015 | 0.482607 | 0.00445300 | 18.8690 | 04920010 | 0.00000 | 0.487060 | 19.0220 |